
Volume analysis trading is the key to understanding market conviction behind price moves. Furthermore, it helps traders distinguish between strong trends and weak fakeouts that trap beginners.
What Is Volume in Trading?
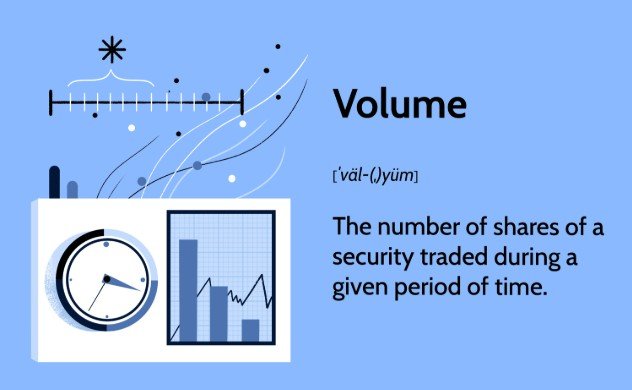
Volume measures the total number of shares or contracts traded during a specific timeframe. Consequently, high volume indicates strong market participation and validates price movements. In contrast, low volume suggests weak conviction and potential reversals ahead.
Why Volume Analysis Matters
Volume confirms whether price movements have real strength behind them. Moreover, professional traders use volume to spot institutional activity before major moves occur. Without volume confirmation, even dramatic price moves often fail quickly.
Key Volume Trading Principles:
Price and Volume Relationships
Understanding how price and volume interact reveals market psychology:
- Price up, volume up: Bullish confirmation showing strong buying pressure
- Price up, volume down: Bearish divergence warning of weakening momentum
- Price down, volume up: Bearish confirmation indicating heavy selling
- Price down, volume down: Bullish divergence suggesting sellers are exhausted
Volume Spike Significance
Volume spikes of 200-300% above the 20-period average signal important market events. Additionally, these spikes during breakouts typically confirm continuation moves. However, spikes at resistance levels often indicate distribution by institutions.
Essential Volume Trading Strategies:
Breakout with Volume Strategy
Breakouts backed by high volume have significantly higher success rates. First, identify clear support and resistance levels on your charts. Next, wait for price to break through with volume exceeding 2-3x the 20-period average. Finally, enter in the breakout direction with stops just beyond the breakout level.
VWAP Mean Reversion
The Volume Weighted Average Price (VWAP) acts as a magnet for institutional orders. When price deviates 1-2 standard deviations from VWAP with volume support, trade toward VWAP. Consequently, this strategy offers statistical edges during the first two trading hours.
Volume Divergence Strategy
Divergences occur when price makes new highs or lows but volume decreases. These situations often precede trend reversals worth capturing. Therefore, prepare contrarian setups with tight stops at recent structure levels.
Top Volume Indicators to Use:
On-Balance Volume (OBV)
OBV tracks cumulative volume flow to confirm trend direction. As a result, rising OBV during uptrends validates bullish momentum. Conversely, falling OBV warns of underlying weakness despite rising prices.
Money Flow Index (MFI)
The MFI combines price and volume to measure buying and selling pressure. Furthermore, readings above 80 indicate overbought conditions while readings below 20 suggest oversold levels. This oscillator helps time entries and exits more precisely.
Chaikin Money Flow (CMF)
CMF measures the accumulation and distribution of money over time. Positive readings indicate buying pressure while negative readings show selling pressure. Therefore, CMF helps confirm whether institutions are accumulating or distributing positions.
Volume Analysis Rules for Success:
Reading Volume at Critical Levels
High volume at support or resistance validates these zones as significant. Meanwhile, volume accumulation at specific price levels indicates institutional interest. Pay close attention during breakouts since volume gaps suggest rapid directional movement ahead.
Volume During Market Phases
Different market phases show distinct volume characteristics:
- Accumulation phase: Higher volume on up days signals bullish momentum building
- Distribution phase: Higher volume on down days indicates increasing selling activity
- Volume dry-up: Very low volume suggests potential trend weakness or consolidation
Common Volume Analysis Mistakes
Trading low-volume breakouts leads to frequent stop-outs. Similarly, ignoring volume divergences causes traders to hold losing positions too long. Instead, always combine volume with price action and technical indicators for confirmation.
Practical Volume Trading Tips
Start by observing volume behavior during the first two hours when institutional participation peaks. Additionally, mark high-volume nodes on your charts since they act as future support and resistance. Finally, use volume to size positions larger when confirmation is strong and smaller when volume is weak.
Volume analysis transforms price charts from two-dimensional to three-dimensional by adding the crucial element of market conviction. Master these volume principles to trade with the smart money instead of against it.
If you want to read up furher on this topic, go check out more info here.

Leave a Reply