
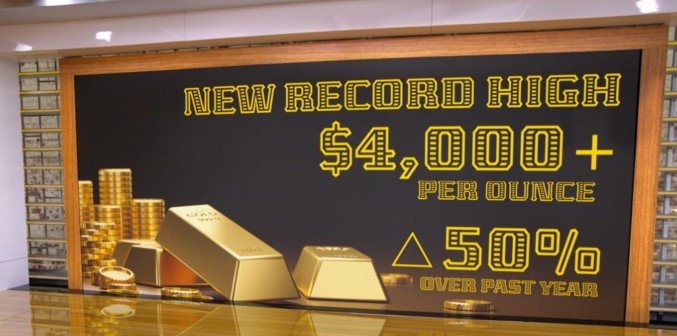
Gold surged to an all-time record high of $4,426 per ounce on December 22, 2025, while silver simultaneously broke through historic resistance levels as the U.S. dollar collapsed across the board. Furthermore, this represents a stunning $1,814 increase from one year ago, marking one of the most explosive precious metals rallies in decades driven by Federal Reserve rate cut expectations, geopolitical tensions, and a historic shift away from dollar-denominated assets.
Why Gold and Silver Are Exploding Higher
The precious metals surge stems from a powerful convergence of factors creating perfect storm conditions. Fed rate cut expectations following December’s third consecutive rate reduction to 3.5% have slashed the opportunity cost of holding non-yielding assets like gold. Additionally, the weakening dollar makes gold cheaper for international buyers, triggering massive purchasing waves from Asian markets and Middle Eastern sovereign wealth funds.
Geopolitical tensions are escalating simultaneously across multiple fronts. President Trump’s intensified Venezuela oil blockade, ongoing trade tensions, and threats to Federal Reserve independence have investors fleeing to safe-haven assets. Central banks are accelerating their gold purchases to reduce dollar dependency, particularly emerging market nations diversifying away from U.S. Treasury holdings. This institutional buying provides a solid price floor even when speculative positioning becomes crowded.
Silver’s rally is even more dramatic, up an astounding 120% in 2025 to breach $65 per ounce for the first time ever. The white metal benefits from dual demand drivers—both safe-haven flows and surging industrial consumption from solar panels, electric vehicles, and AI data centers. The market faces its fifth consecutive year of supply deficits as stagnant mining output fails to meet exploding demand.
Trading Gold’s Record Breakout
Gold Futures and ETFs
The most accessible way to trade gold’s breakout is through the SPDR Gold Shares ETF (GLD), which tracks physical gold prices. With gold clearing $4,400 resistance decisively, technical analysis suggests minimal overhead resistance until $4,600-$4,700. Use pullbacks to the $4,350 breakout level as buying opportunities with stops below $4,300 to maintain favorable risk-reward ratios.
Futures traders can access leveraged exposure through gold futures contracts, though this requires understanding margin requirements and overnight financing costs. The December contract is showing extreme strength with expanding open interest, indicating genuine institutional accumulation rather than speculative froth. Moreover, the gold/silver ratio compressed sharply today, suggesting silver may offer even better upside potential in the near term.
iShares Gold Trust (IAU) provides a lower-cost alternative to GLD for investors prioritizing expense ratios. Both ETFs hold physical gold in vaults, eliminating counterparty risk inherent in paper gold instruments. During periods of financial stress, physical-backed ETFs significantly outperform synthetic products that rely on derivatives.
Gold Mining Stocks
Mining stocks typically provide leveraged exposure to gold price movements because operational costs remain relatively fixed while revenue expands with higher gold prices. The VanEck Gold Miners ETF (GDX) offers diversified exposure to major producers like Newmont, Barrick Gold, and Agnico Eagle. These companies are printing money at current gold prices since their all-in sustaining costs average $1,200-$1,400 per ounce.
Junior miners provide even more aggressive exposure through the VanEck Junior Gold Miners ETF (GDXJ). These smaller exploration companies can generate 200-300% returns during sustained gold rallies but carry significantly higher bankruptcy risk during corrections. Therefore, position sizing becomes critical—never allocate more than 2-3% of your portfolio to individual junior miners regardless of their geological prospects.
Watch for mining stocks that are breaking out to new 52-week highs alongside gold but showing relative strength compared to the metal itself. This divergence often signals that sophisticated investors anticipate sustained higher prices. Additionally, mining stocks tend to bottom before gold during corrections, providing early warning signals for precious metals traders.
Silver Trading Strategies
Physical Silver vs. Paper Markets
Silver’s 120% gain in 2025 dwarfs even gold’s impressive performance, driven by industrial demand that gold doesn’t face. The iShares Silver Trust (SLV) provides liquid exposure without storage hassles associated with physical metal. However, silver markets are notoriously volatile—daily moves of 5-8% are common compared to gold’s typical 1-2% range.
The gold-silver ratio compressed from 75:1 to approximately 65:1 during today’s session, suggesting silver is catching up to gold’s strength. Historically, ratios below 60:1 indicate silver is expensive relative to gold, while readings above 80:1 suggest silver offers better value. Current levels suggest room for additional silver outperformance if the precious metals bull market continues.
Physical silver demand is surging from multiple angles simultaneously. Solar panel installations are accelerating globally as countries pursue renewable energy goals. Electric vehicles require significantly more silver than traditional cars due to extensive electrical systems. AI data centers consume massive amounts of silver in servers and connectivity infrastructure. This industrial floor under silver prices provides fundamental support that pure monetary metals lack.
Dollar Collapse Implications
Currency Markets
The U.S. Dollar Index crashed through key support levels today, accelerating the “great debasement trade” that’s been building throughout 2025. When the world’s reserve currency weakens, capital floods into alternative stores of value. Gold traditionally moves inversely to the dollar because international buyers find it cheaper when their local currencies strengthen against the greenback.
EUR/USD surged above 1.12 as the interest rate differential between U.S. and European rates narrows. The Federal Reserve’s aggressive easing while other central banks maintain tighter policy creates powerful currency flows. Forex traders can position for continued dollar weakness through currency pairs or the Invesco DB USD Index Bearish Fund (UDN), which provides inverse dollar exposure.
Emerging market currencies are rallying sharply as dollar weakness reduces their debt servicing costs and improves trade competitiveness. Countries that borrowed heavily in dollars during the strong-dollar period now benefit from effective debt reduction. This dynamic supports commodity-producing nations whose exports become more competitive globally.
Positioning for Continued Precious Metals Strength
Central Bank Buying Continues
Central banks purchased over 1,000 tons of gold in the first three quarters of 2025, continuing the aggressive accumulation that began in 2022. China, India, and Middle Eastern nations are leading this diversification away from dollar reserves. This institutional buying provides a price floor that didn’t exist during previous gold bull markets, fundamentally changing the supply-demand dynamics.
The shift reflects growing concerns about U.S. fiscal sustainability. With debt approaching $36 trillion and deficits exceeding $2 trillion annually, foreign central banks are hedging dollar exposure through gold accumulation. This trend appears structural rather than cyclical, suggesting support for gold prices even during temporary corrections. Therefore, dips should be viewed as accumulation opportunities rather than trend reversals.
Inflation Hedge Characteristics
Despite the Fed cutting rates, inflation concerns haven’t disappeared. Core inflation remains above the Fed’s 2% target, and fiscal stimulus combined with tariff policies threatens to reignite price pressures. Gold serves as the ultimate inflation hedge because its purchasing power has remained relatively stable across centuries while fiat currencies inevitably depreciate.
The real interest rate—nominal rates minus inflation—determines gold’s opportunity cost. When real rates turn negative, gold becomes exceptionally attractive because savers lose purchasing power holding cash or bonds. Current conditions feature declining nominal rates while inflation persists, creating the negative real rate environment where gold historically performs best. This fundamental backdrop supports continued strength even after today’s dramatic moves.
Risk Management for Precious Metals Trades
Volatility Considerations
Today’s explosive move in gold and silver will likely trigger profit-taking in coming sessions. Don’t chase prices after 2-3% daily moves—wait for pullbacks to logical support levels. Use the 20-period moving average on daily charts as your entry guide for swing trades, entering only when price tests the MA and shows rejection with strong bullish candles.
Position sizing becomes even more critical during breakout periods when volatility expands. Calculate your stop distance from entry to key support, then work backwards to determine appropriate share quantities. Never risk more than 1-2% of account value on any single precious metals position, regardless of conviction level. The metals can experience violent 10-15% corrections even within bull markets.
Options strategies provide defined-risk exposure during uncertain periods. Buying call options on GLD or SLV limits downside to the premium paid while maintaining unlimited upside potential. This approach works particularly well when implied volatility is relatively low despite strong directional moves. However, be aware that implied volatility often spikes after big moves, making options more expensive.
Technical Analysis of Gold’s Breakout
Key Resistance Levels Ahead
Gold cleared the previous all-time high around $4,380 decisively, establishing that level as new support. The next resistance zones don’t appear until $4,600-$4,700, where Fibonacci extension targets cluster. This creates a low-resistance trading environment where momentum can accelerate rapidly without overhead supply constraining upside.
Volume analysis confirms the breakout’s legitimacy. Today’s trading volume in GLD exceeded the 20-day average by over 150%, indicating strong institutional participation rather than retail speculation. High-volume breakouts typically continue for multiple sessions before consolidating gains. Additionally, breadth indicators show broad participation across the precious metals complex rather than isolated strength in gold alone.
Moving averages are aligning bullishly across all timeframes. The 50-day moving average just crossed above the 200-day, creating the “golden cross” pattern that technical analysts view as long-term bullish confirmation. Short-term moving averages like the 9 and 20 EMA are sloping sharply higher with expanding separation, indicating accelerating momentum.
Alternative Ways to Play the Move
Commodity Producers
Beyond precious metals miners, consider copper producers and other base metal companies that benefit from dollar weakness. Copper hit record highs near $12,000 per ton during today’s session, driven by the same forces supporting gold. Freeport-McMoRan and Southern Copper provide liquid exposure to the copper trade while offering dividend income that pure gold plays lack.
Energy stocks offer another angle on the dollar collapse theme. A weaker dollar typically supports oil and gas prices because these commodities are priced in dollars globally. The Venezuela situation adds geopolitical premium to crude prices. Energy Select Sector SPDR (XLE) provides diversified exposure to integrated majors that benefit from higher oil prices.
Real assets more broadly tend to outperform during periods of currency debasement. Real estate investment trusts, particularly those focused on hard assets like industrial properties or data centers, provide both inflation protection and income generation. Consider the Vanguard Real Estate ETF (VNQ) for diversified exposure to this theme.
Market Timing Considerations
Fed Meeting Impact
The next Federal Reserve meeting in late January 2026 will provide crucial guidance on the pace of future rate cuts. If Powell signals a pause in the easing cycle due to sticky inflation, gold might consolidate recent gains. Conversely, dovish rhetoric about continued gradual cuts would likely fuel another leg higher. Monitor Fed fund futures probabilities leading into the meeting for positioning clues.
Seasonal patterns suggest precious metals often pull back in January as tax-loss harvesting ends and profit-taking occurs after year-end rallies. However, 2025’s extraordinary strength may override typical seasonality. Strong hands who accumulated throughout the year are unlikely to sell after just breaking out to new highs. Therefore, any January weakness probably represents buying opportunities rather than trend reversals.
Technical corrections of 5-10% are normal and healthy even during bull markets. These pullbacks shake out weak hands and reset overbought indicators, creating fuel for the next advance. Don’t panic sell during routine consolidations—instead, use predetermined technical levels to add to positions systematically. The 50-day moving average, currently around $4,150, represents the first major support zone worth watching.
Long-Term Implications
The precious metals breakout reflects deeper concerns about fiat currency sustainability and geopolitical stability. U.S. fiscal deficits show no signs of moderating regardless of which party controls government. This structural tailwind for gold appears likely to persist for years rather than months. Additionally, the shift in central bank behavior—away from dollar reserves toward gold—represents a multi-decade trend in its early stages.
Technology developments in blockchain and digital currencies haven’t diminished gold’s appeal as assumed. Instead, gold is increasingly viewed as the ultimate analog store of value in an increasingly digital world. This complementary relationship rather than competitive dynamic supports gold’s role in diversified portfolios. Moreover, younger investors are discovering precious metals for the first time, broadening the demographic base.
Gold’s record high today marks a continuation of the bull market that began in 2019, not a climactic blow-off top. The fundamental drivers—negative real rates, fiscal concerns, geopolitical tensions, and central bank buying—remain firmly in place. Trade the moves systematically rather than emotionally, use proper risk management, and recognize that this precious metals cycle likely has years left to run.

Leave a Reply