
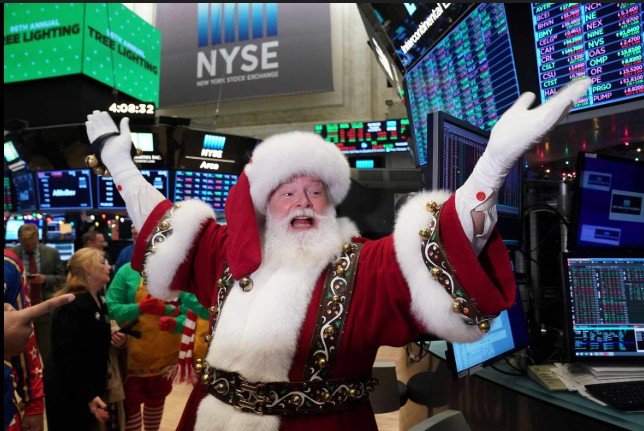
The Santa Claus Rally typically delivers 1.3% gains in the last week of December. Moreover, swing traders profit from this seasonal pattern using proven strategies backed by decades of data.
Introduction
Every December, Wall Street waits for one of the most reliable seasonal patterns in trading: the Santa Claus Rally. Specifically, this year-end phenomenon—defined as the final five trading days of December plus the first two trading days of January—historically produces positive returns 78% of the time. Furthermore, it averages gains of 1.3% on the S&P 500.
This year presents unique opportunities. With the Fed cutting rates to 3.5%, inflation cooling to 2.7%, and small-cap stocks hitting all-time highs this week, the 2025 Santa Claus Rally could be exceptionally strong. Therefore, the combination of low interest rates, strong consumer spending, and institutional portfolio window dressing creates the perfect setup. Swing traders can capitalize on year-end momentum with precise timing.
In this guide, we break down what the Santa Claus Rally is, why it happens, which stocks benefit most, and exactly how to position your portfolio. You’ll learn to profit from the final trading days of 2025.
What Is the Santa Claus Rally?
The Santa Claus Rally refers to the tendency for stock markets to rally during a specific seven-day window. Specifically, this includes the last five trading days of December and the first two trading days of January. Historically, this period outperforms the rest of the year by a significant margin.
The Stats Don’t Lie
Consider these numbers:
- 78% win rate since 1950 (S&P 500 rises in this period)
- Average gain: 1.3% in just seven trading days
- Best year: 1991 gained 5.3% during the Santa Rally
- Worst year: 2000 lost 3.2% during the dot-com bubble
This week marks the start of the 2025 Santa Claus Rally period (December 24-31 + January 2-3, 2026). Based on current conditions—rate cuts, cooling inflation, and record small-cap highs—we could see an above-average rally this year.
The Santa Claus Rally phenomenon has been extensively documented by financial researchers. The Stock Trader’s Almanac, which first identified this pattern in 1972, tracks this seven-day period annually. Moreover, it publishes detailed historical performance data showing the S&P 500’s consistent year-end strength. This research forms the foundation of seasonal trading strategies used by institutional investors.
Why Does the Santa Claus Rally Happen?
The Santa Rally isn’t just folklore. Instead, there are legitimate market mechanics driving year-end gains.
Tax-Loss Harvesting Ends
Throughout December, investors sell losing positions to offset capital gains taxes. This process, called “tax-loss harvesting,” creates selling pressure. However, by December 20-23, this selling pressure stops completely. Money rotates back into stocks, creating significant buying pressure.
Holiday Optimism and Light Volume
Trading volume drops 30-50% during the holidays as institutional traders take vacation. Consequently, with fewer sellers and optimistic holiday sentiment, even modest buying pushes prices higher. Therefore, liquidity conditions favor upward price movement.
Year-End Bonuses Deployed
Fund managers receive year-end bonuses and performance fees in late December. Interestingly, many reinvest this capital immediately in January. As a result, front-running their own buying creates December strength.
Window Dressing
Portfolio managers buy winning stocks in late December. The reason is simple: they want their year-end holdings reports to look good for clients. This practice, called “window dressing,” artificially inflates prices of top performers.
January Effect Setup
Investors position for the “January Effect” by buying small-cap stocks in late December. Since small-caps typically outperform in January, this advance buying drives up prices before the calendar flips.
This year’s unique catalyst: The Fed’s third consecutive rate cut this week amplifies all five factors. Furthermore, low rates make stocks more attractive. Additionally, tax-loss selling ended early as markets rallied hard on CPI data.
Which Stocks Benefit Most from the Santa Rally?
Not all stocks participate equally. Here’s where the smart money focuses.
Small-Cap Stocks – The Biggest Winner
Small-caps historically outperform large-caps during the Santa Rally by 2:1 margins. Day traders and swing traders both capitalize on this pattern using different timeframes.
Here’s why small-caps lead:
First, January Effect anticipation drives early buying. Investors front-run small-cap strength expected in January.
Second, tax-loss selling reversal creates outsized rebounds. Small-caps get hit hardest by December tax selling. Therefore, the rebound is strongest.
Third, rate sensitivity provides a catalyst. With rates at 3.5%, small-caps with variable debt benefit most.
This year’s momentum indicator: Russell 2000 just hit all-time highs at 2,450 this week. The momentum is already building.
Trade setup:
- IWM (iShares Russell 2000 ETF) targeting 2,500-2,550
- Entry: Pullbacks to 2,420-2,430
- Stop: Below 2,400 (previous support)
Retail Stocks Drive Consumer Strength
Holiday shopping data drives retail stocks in late December. Simply put, strong sales equal post-Christmas rallies.
Key tickers to watch:
- Amazon (AMZN) – ecommerce leader
- Target (TGT) – holiday shopping bellwether
- Nike (NKE) – just reported earnings this week
- XRT (Retail ETF) – diversified exposure
Watch for this: Holiday sales data releases (Dec 26-30). Beat expectations and the rally extends into January.
Technology Stocks Lead Mega-Cap Momentum
Big tech dominates Santa Rallies for several reasons.
First, window dressing matters. Fund managers want Apple, Microsoft, and Nvidia in year-end reports.
Second, strong Q4 earnings are expected in January. Therefore, positioning happens early.
Third, low volume allows mega-caps to drift higher without resistance.
This year’s edge: Micron surged 10% this week on strong earnings. Consequently, this ignited chip sector momentum just as Santa Rally begins.
Trade setup:
- QQQ (Nasdaq 100 ETF) – broke 21,000 this week
- SMH (Semiconductors) – riding Micron momentum
- MSFT, AAPL, NVDA – individual mega-cap plays
Contrarian Play: Previous Year’s Losers
Stocks beaten down all year often bounce during Santa Rally. The reason? Tax-loss selling ends and bargain hunters return.
2025 beaten-down sectors to watch:
- Energy stocks (down on oil price weakness)
- Certain biotech names (small-cap healthcare)
- Regional banks (KRE ETF – lagging but rate-sensitive)
Contrarian strategy: Scan for stocks down 20-40% year-to-date. Look for positive Q4 earnings catalysts that could trigger reversals.
How to Trade the Santa Claus Rally
Follow this step-by-step strategy to maximize year-end gains.
Position 2-3 Days BEFORE the Official Window
The Santa Rally officially starts December 24. However, smart traders position December 20-23 to capture early gains.
What to buy now:
- Small-cap ETFs (IWM, IJR)
- Tech leaders (QQQ, SMH)
- Retail stocks with strong holiday sales data
Use the “Santa Surprise” Indicator
If the market DOESN’T rally during the Santa window, it’s historically a bearish signal. This phenomenon, called “No Santa, No Rally,” warns of January-February weakness.
The rule is simple: If S&P 500 is DOWN during the 7-day Santa window, January often sees 3-5% corrections.
This year’s probability: With Fed rate cuts, cooling inflation, and strong momentum, a failed Santa Rally is unlikely. Current odds: less than 15% chance based on present data.
Take Profits January 3-5
The Santa Rally ends January 3. Therefore, don’t overstay the trade. Managing risk properly means having predetermined exit rules regardless of emotional attachment to winners.
Profit-taking plan:
- Sell 50% of positions January 2-3 (lock in gains)
- Trail stops on remaining 50% (let winners run if January Effect continues)
- Avoid holding through mid-January earnings volatility
Watch the January Barometer
Wall Street saying: “As January goes, so goes the year.” Historically, if January is positive, the full year tends to be positive 85% of the time.
Your strategy: Use Santa Rally profits to position for January Effect winners. Focus on small-caps, value stocks, and international markets.
Advanced Strategy: Santa + January Effect Combo
The most profitable approach combines the Santa Rally with the January Effect. This dual strategy targets small-cap outperformance across both periods.
The complete trade:
December 20-23: Buy IWM (Russell 2000 ETF) at 2,420-2,430
December 24-31: Ride Santa Rally to 2,480-2,500 (+2-3%)
January 2-15: Hold for January Effect continuation to 2,550-2,600 (+5-7% total)
January 15-20: Exit before Q4 earnings volatility
Risk management:
- Stop loss: 2% below entry (tight stop due to high win rate)
- Position size: 10-15% of portfolio (concentrated seasonal bet)
- Hedge: Buy VIX calls if rally fails (insurance against “No Santa” scenario)
What Could Derail the 2025 Santa Rally?
While the odds favor a rally, here are risks to monitor carefully.
Disappointing Holiday Sales Data
If retail sales miss expectations (released Dec 26-30), consumer discretionary stocks will sell off. Consequently, this drags the broader market down.
Geopolitical Shock
Year-end is historically calm. However, unexpected wars, tariffs, or political crises can spike volatility and kill Santa momentum instantly.
Fed Hawkish Surprise
If Fed Chair Powell signals rate HIKES in 2026, the rally reverses instantly. That said, this is unlikely given 2.7% inflation. Nevertheless, monitor Fed communications closely.
Profit-Taking After Strong 2025
If the S&P 500 is up 25%+ for the full year 2025, some institutions may lock in gains. Rather than chasing year-end momentum, they preserve profits.
Current probability of Santa Rally success: 80-85% based on historical data plus current macro conditions. Rate cuts, low inflation, and strong momentum all support upside.
Historical Santa Rally Data
Best Santa Rallies (S&P 500 Gains):
- 1991: +5.3% (recession recovery rally)
- 2008: +4.2% (oversold bounce after financial crisis)
- 2010: +3.8% (QE2 liquidity surge)
Worst Santa Rallies (S&P 500 Losses):
- 2000: -3.2% (dot-com bubble bursting)
- 2015: -2.2% (oil crash, Fed rate hike fears)
- 2018: -1.8% (Fed hawkish guidance spooked markets)
2025 Comparison:
- Rate environment: Cutting (bullish, like 2008-2010)
- Inflation: Cooling (bullish, unlike 2000/2015)
- Market momentum: Strong (small-caps at all-time highs, tech rebounding)
Verdict: 2025 setup resembles strong Santa Rally years more than weak years.
Your Santa Rally Trading Checklist
✅ Santa Rally = Last 5 days of Dec + first 2 days of Jan (7 trading days)
✅ 78% historical win rate, 1.3% average gain (S&P 500)
✅ Best sectors: Small-caps, tech, retail, beaten-down contrarian plays
✅ Position NOW (Dec 20-23) before official window starts
✅ Take profits Jan 2-5 – don’t overstay the trade
✅ Watch “No Santa, No Rally” signal for January warnings
✅ 2025 setup is bullish: Rate cuts + cooling inflation + strong momentum
What’s Next: Positioning for January 2026
The Santa Rally is just the appetizer. In fact, the main course is the January Effect. Historically, small-caps outperform large-caps by 3-5% in January alone.
How to prepare:
- Use Santa Rally profits to load small-cap value stocks (IWN, IWO)
- Rotate OUT of mega-cap tech (take profits) and INTO beaten-down small-caps
- Watch Q4 earnings calendar (starts Jan 15) – position ahead of positive surprises
The traders who win year-end aren’t the ones chasing December 31 momentum. Instead, they’re the ones who positioned December 20. They rode the Santa Rally and transitioned seamlessly into January Effect winners.
Final trading days of 2025 start NOW. The Santa Claus Rally waits for no one. Are you positioned?
If you want further reading on this topic, check out Santa Rally and what it means here.

Leave a Reply