Table of Contents Expand
Learning how to stop revenge trading is the single most critical milestone in retail speculation. While bad technical analysis causes paper cuts, emotional escalation causes catastrophic bleed-outs.
Every active day trader and swing trader recognizes the sequence: a disciplined setup gets stopped out, frustration surges, and within minutes, position sizes double, stop losses disappear, and arbitrary orders hit the tape. This is not a technical failure—it is an acute neurological hijack known in competitive environments as tilt. Don’t forget that you must always know the overall market sentiment before entering any trade on any given day. You can do this easily every morning by checking our free SPY Market Regime tool.
To survive long enough to extract an edge, you cannot rely on willpower or vague advice to “breathe deeply.” You must quantify the mathematical cost of emotional escalation and enforce mechanical, automated fail-safes. This guide breaks down the biological triggers of trading tilt, provides an interactive simulation tool to calculate your emotional equity leakage, and delivers an institutional protocol to permanently stop revenge trading.
Tilt & Revenge Trade Cost Simulator
Quantify the mathematical cost of emotional trade escalation versus disciplined rule execution.
Key Takeaway: Escalating risk from 1% to 2% after a loss does not double your recovery speed; due to the asymmetric nature of drawdowns, it compounds account variance and demands exponential win rates just to return to breakeven.
What Is Revenge Trading? (The Neurobiology of Tilt)
Revenge trading is the compulsive execution of irrational, unscheduled market orders directly following a perceived unfair loss, missed breakout, or early profit exit. The psychological mechanism driving this behavior is rooted in Loss Aversion, a foundational cognitive bias identified by Daniel Kahneman and Amos Tversky indicating that the emotional pain of losing capital is psychologically twice as potent as the pleasure of gaining equivalent profit.
When a trade violates your expectations, your brain perceives financial loss identically to a physical threat. The amygdala activates a biological fight-or-flight response, flooding your system with adrenaline and cortisol. Simultaneously, the prefrontal cortex—the sector responsible for probabilistic assessment, risk calculation, and disciplined execution—temporarily degrades.
In this neurological state, a trader is no longer assessing high-probability liquidity pools or order flow; they are attempting to alleviate immediate emotional distress by forcing the market to return their capital. This creates the classic "tilt death spiral":
- Initial Loss (The Catalyst): A routine, expected loss occurs within normal strategy variance.
- Ego Threat (The Trigger): The trader refuses to accept the negative feedback loop of the market.
- Size Escalation (The Martingale Fallacy): Risk is increased on the next execution to recover previous losses in a single print.
- Execution Drift (The Violation): Setups are taken outside the trading plan, often in lower-timeframe chop.
- Account Ruin (The Capitulation): Margin calls, forced broker liquidations, or massive daily maximum loss triggers fire.
The Quantitative Mathematics of Trading Tilt
Most retail traders view emotional discipline as a moral virtue rather than a mathematical necessity. However, looking at account equity through the lens of pure expected value reveals the structural danger of tilt.
When you maintain strict position sizing, recovering from a losing streak is linear. But when tilt introduces variable sizing, your recovery trajectory becomes highly non-linear. As modeled in our True Portfolio Heat Calculator, unmanaged open exposure drastically increases correlated portfolio drag, transforming standard variance into permanent impairment.
| Account Loss | Gain Required to Breakeven | Tilt Implication |
|---|---|---|
| -5% | +5.26% | Easily recoverable within 3–5 systematic base-risk trades. |
| -10% | +11.11% | Standard prop firm daily trailing drawdown boundary. |
| -20% | +25.00% | Requires abnormal market conditions or elevated risk to regain parity. |
| -50% | +100.00% | Statistical point of no return; permanent account ruin. |
When you size up to recover a loss, you rely on the Gambler's Fallacy—the mistaken belief that because you experienced two or three consecutive losses, your next trade has a statistically higher probability of winning. In real-world market execution, independent trade distributions remain strictly random regardless of your emotional state.
The 4 Archetypes of Trading Tilt
Trading tilt does not always manifest as furious market clicking. It operates across multiple behavioral vectors that require distinct diagnostic checks:

1. Aggressive Tilt (The Punisher)
The trader views the market as a sentient opponent that stole their capital. Signs include slamming keys, doubling lot sizes, shorting bottoms out of spite, and aggressively fading momentum without an edge.
2. Desperation Tilt (The Chaser)
Triggered by watching a setup trigger and run without an execution fill. The trader suffers from intense FOMO, enters late at the extremes of a distribution curve, and accepts a heavily distorted risk-to-reward profile.
3. Protective Tilt (The Turtle)
Following a painful loss, the trader freezes. When high-conviction signals appear, hesitation prevents execution. If entered, profits are harvested within seconds at +0.2R for fear of giving back gains, severely truncating positive trade expectancy.
4. Euphoric Tilt (The God Complex)
Occurs after an exceptional winning streak. Dopamine desensitizes risk perception. The trader feels untouchable, abandons hard stop losses, over-leverages, and gives back an entire month's worth of gains in a single afternoon session.
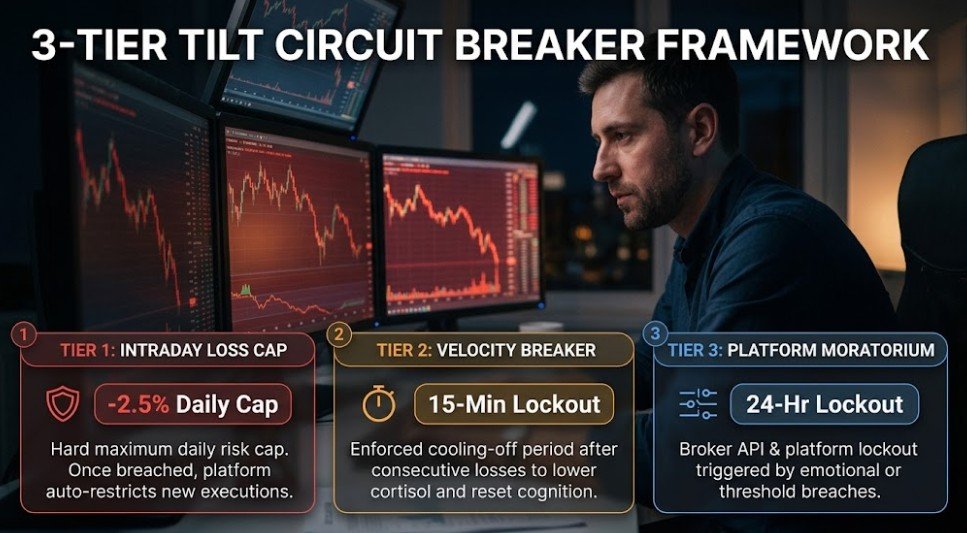
The 3-Tier Tilt Circuit Breaker Framework
Willpower consistently fails under elevated cortisol levels. To safeguard capital, professional prop desks and institutional trading operations install programmatic fail-safes that sever execution access before tilt cascades into liquidation.
Tier 1: Intraday Loss Limits & Dynamic Sizing
Your maximum allowable daily loss should never exceed 2x to 3x your standard trade risk. If your base risk is 1% per setup, your daily maximum loss must be hard-capped at 2.5% to 3.0%. For funded prop firm traders, managing this boundary against trailing drawdown rules is critical, as demonstrated in our Prop Firm Dual-Boundary Simulator.
Tier 2: Trade Velocity Limits
Revenge trades happen in rapid succession. Impose a mandatory 15-minute cool-off period after any stop loss execution. Forcing physical distance between trades allows cortisol levels to clear and resets analytical cognition.
Tier 3: Irrevocable Hardware & Broker Kill Switches
When psychological boundaries fail, technical barriers must engage. Modern trading platforms permit auto-lockouts, API disconnects, and daily loss enforcement. Read our comprehensive guide on implementing The Irrevocable Cross Broker Kill Switch to programmatically lock yourself out of your broker terminal the instant your threshold is breached.
Daily Mental Reset Checklist (Pre- and Post-Session)
Incorporate this structured checklist into your trading journal to monitor tilt signals before they materialize on the tape:
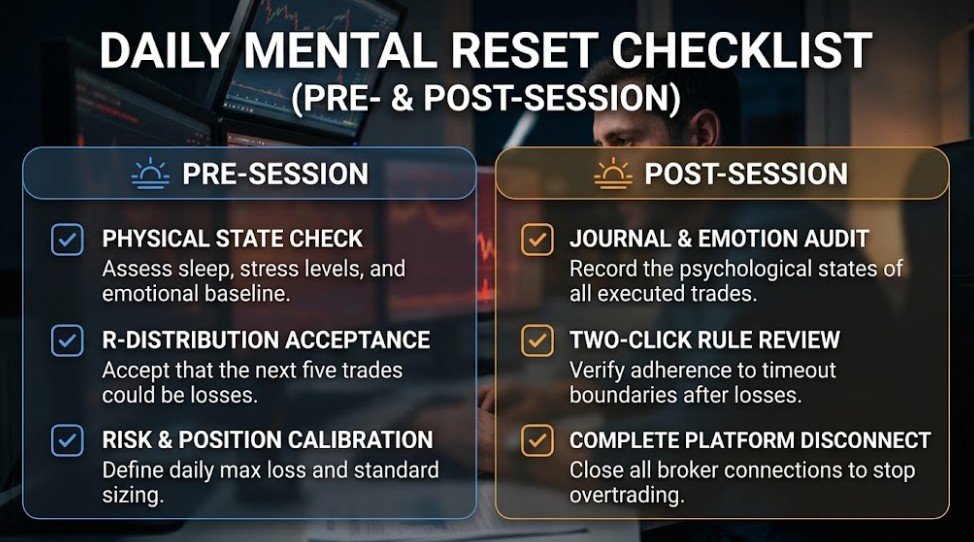
- Physical State Check: Am I operating on less than 6 hours of sleep, experiencing outside stress, or feeling physical agitation? If yes, cut position sizing by 50% for the session.
- R-Distribution Acceptance: Have I mentally accepted that the next 5 trades may all be losses without validating or invalidating my statistical edge?
- Two-Click Rule: If an order is executed and immediately manually closed due to panic, step away from the terminal for 30 minutes.
- Journal Audit: Document every trade's emotional state (Calm, Anxious, Spiteful, Euphoric) alongside technical entry criteria to identify recurring tilt triggers.