Quick Jump Table of Contents
If you ask a retail swing trader how much capital they have at risk heading into the 4:00 PM EST market close, they will almost always give you an arithmetic answer: "I have four open positions, and my stop-loss on each trade is set to 1% of my account. My total portfolio heat is 4%."
On a calm Tuesday afternoon with the Cboe Volatility Index (VIX) pinned under 14, that math holds up.
During a macro shock, a CPI print miss, or a sector-wide rotation, that math will liquidate your account.
Every standard portfolio heat calculator currently ranking on the web commits the same quantitative error: it assumes your open positions are statistically independent and that your stop-loss orders are guaranteed to fill at your exact limit price. In reality, holding four 1%-risk positions in NVDA, AMD, AVGO, and SMCI is not a diversified 4% risk book—it is a single, highly leveraged bet on the semiconductor complex that will gap straight through your stops at 9:30 AM.
Below, you can use the Smart Edge Intel True Portfolio Heat & Overnight Gap Stress-Tester to audit your real drawdown exposure across sector correlation clusters (ρ), SPY Beta tail amplification (β), and overnight Average True Range (ATR) gap slippage.
| Ticker | Cluster | Entry | Stop | Size | Beta | ATR | Naive | True |
|---|
Formulas (ρ, β, ATR)
3. Beta = Naive × max(0, (β − 1.0) × 0.20) | 4. Gap = Shares × ATR × Regime
Portfolio heat is the total percentage of your trading account equity that would be lost if every open position in your portfolio hit its stop-loss simultaneously. First popularized by Dr. Alexander Elder and Van Tharp, tracking portfolio heat prevents a trader from suffering a catastrophic account drawdown through death by a thousand cuts.
The Naive Arithmetic Portfolio Heat Formula
Standard calculators compute portfolio heat using simple addition:
- Naive Position Risk ($) =
|Entry Price − Stop-Loss Price| × Shares - Naive Portfolio Heat (%) =
(Sum of All Position Risks ÷ Total Account Equity) × 100
For example, if you trade a $100,000 account and hold four positions where each stop-loss represents $1,000 of risk ($5.00 stop distance × 200 shares), a conventional calculator reports:
- Naive Portfolio Heat =
($1,000 + $1,000 + $1,000 + $1,000) ÷ $100,000 = 4.00%
Why Naive Portfolio Heat Fails in Modern Markets
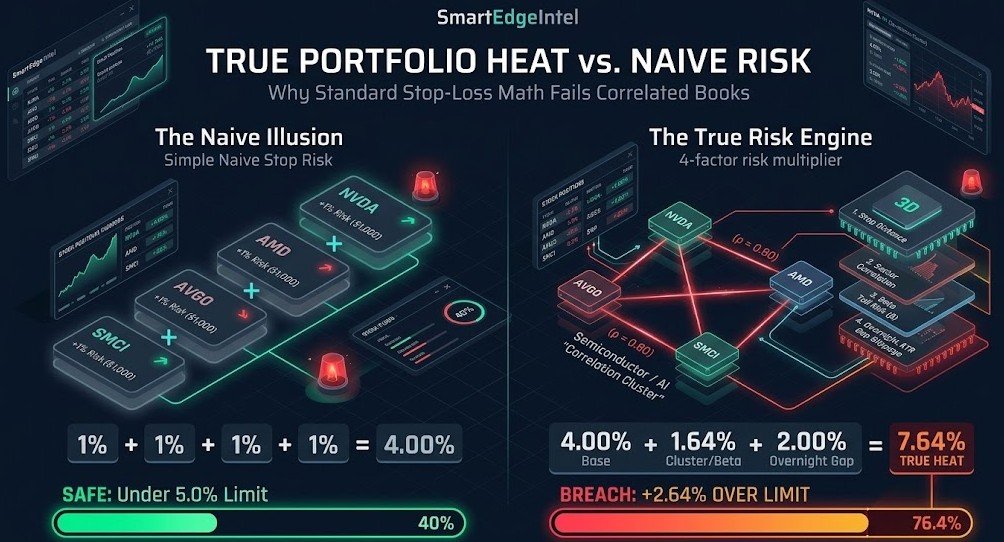
The arithmetic formula relies on two assumptions that break down the moment market volatility expands:
- Zero Pairwise Correlation (ρ = 0): It assumes the probability of Position A stopping out has no bearing on whether Positions B, C, and D stop out at the exact same timestamp.
- Zero Execution Slippage: It assumes liquidity is continuous 24 hours a day and that a stop-market order placed at
$130.00cannot fill at$127.40on an overnight gap.
When institutional risk desks evaluate a book of equities or options, they never look at naive stop sum alone. They model Conditional Value at Risk (CVaR)
—what happens to the book when cross-asset correlations converge toward 1.00 and liquidity gaps across the opening bell.
To bridge the gap between retail stop-loss math and institutional risk management, our calculator layers three structural risk multipliers onto your open positions.
1. Pairwise Sector Correlation (ρ) Synchronization
In calm regimes, individual stocks within a sector exhibit moderate dispersion. During a macro de-risking event, sector ETFs (SMH, XLK, XLF, IBIT) are sold basket-style by algorithmic execution engines. Every morning you should find out the overall market sentiment. You can do this with our free SPY Market Regime tool.
When basket selling hits, pairwise correlations (ρ) inside high-momentum clusters jump to 0.75–0.90. If you hold four positions in the same correlation cluster, you do not have four independent trades—you have one oversized macro trade split across four ticker symbols.
2. SPY / QQQ Beta Tail Amplification (β)
A stock's Beta (β) measures its volatility sensitivity relative to the S&P 500 (SPY). A ticker with a Beta of 2.0 moves roughly twice as far as the benchmark index on an average session.
However, high-beta momentum equities (such as TSLA, MSTR, COIN, and SMCI) suffer from asymmetric downside beta during liquidity shocks. When the S&P 500 gaps down 1.2% overnight, a 2.2-Beta stock rarely drops a polite 2.6%—high-beta crowding forces rapid margin deleveraging that magnifies tail losses well beyond linear stop projections.
3. Overnight ATR Gap Slippage (The Stop-Order Illusion)
A stop-loss order is not an insurance policy; as the U.S. Securities and Exchange Commission (SEC) outlines, it is a conditional trigger that converts into a market order once price trades at or through your stop level.
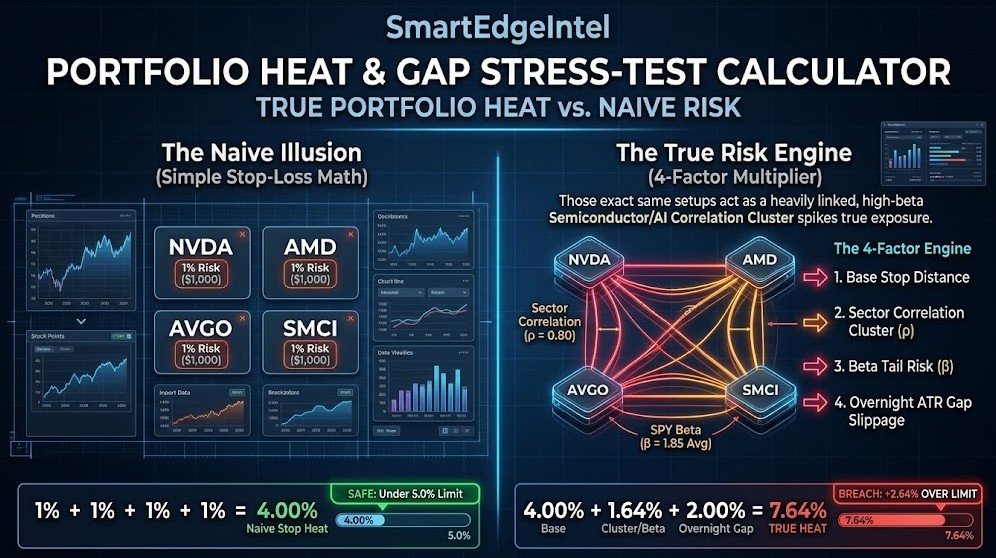
If you close the session holding a swing position with a $5.00 stop distance, and an unexpected geopolitical headline or sector earnings miss triggers a 1.5x Daily ATR overnight gap-down, the market opens below your stop price. Your broker executes your market order at the 9:30 AM opening print, locking in unhedged gap slippage on every single share.
The Smart Edge Intel True Portfolio Heat Engine evaluates each open position across five sequential risk components:
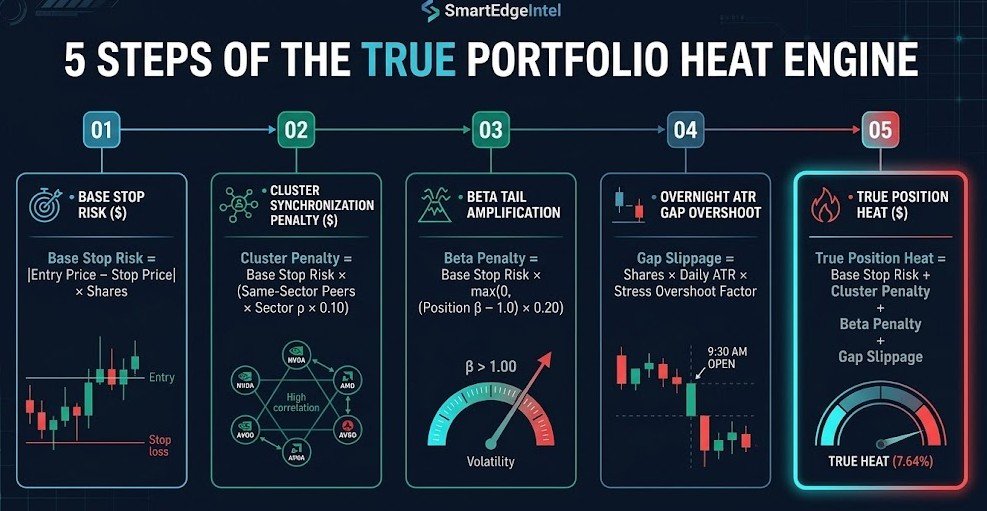
- Base Stop Risk ($):
Base Stop Risk = |Entry Price − Stop Price| × Shares - Cluster Synchronization Penalty ($):Counts the number of same-sector peers in your active book and weights them by the sector's baseline correlation coefficient (ρ):
Cluster Penalty = Base Stop Risk × (Same-Sector Peers × Sector ρ × 0.10) - Beta Tail Amplification ($):Applies a volatility tail surcharge to positions with an S&P 500 Beta (β) exceeding
1.00:Beta Penalty = Base Stop Risk × max(0, (Position β − 1.0) × 0.20) - Overnight ATR Gap Overshoot ($):Models the dollar loss incurred when price gaps past your stop price under your selected stress regime (
0.00x,0.25x,0.50x, or0.85xof 14-day Daily ATR):Gap Slippage = Shares × Daily ATR × Stress Overshoot Factor - True Position Heat ($):
True Position Heat = Base Stop Risk + Cluster Penalty + Beta Penalty + Gap Slippage
Let's examine the default "AI / Semi Cluster Trap" preset loaded in the calculator above.
Suppose a swing trader with a $100,000 account and a strict 5.00% ($5,000) Maximum Portfolio Heat rule enters four bullish breakout setups across NVDA, AMD, AVGO, and SMCI. On each trade, they risk exactly 1.00% ($1,000 across 200 shares with a $5.00 stop distance).
Here is what a basic portfolio heat calculator shows versus what happens during a 1.5x ATR Overnight Macro Shock:
| Ticker | Shares | Stop Distance | SPY Beta (β) | Daily ATR | Naive Stop Risk ($) | Cluster + Beta Penalty ($) | 1.5x ATR Gap Slippage ($) | True Position Heat ($) |
|---|---|---|---|---|---|---|---|---|
| NVDA | 200 | $5.00 | 1.85 | $4.80 | $1,000 (1.00%) | +$410 | +$480 | $1,890 (1.89%) |
| AMD | 200 | $5.00 | 1.75 | $5.20 | $1,000 (1.00%) | +$390 | +$520 | $1,910 (1.91%) |
| AVGO | 200 | $5.00 | 1.55 | $6.00 | $1,000 (1.00%) | +$350 | +$600 | $1,950 (1.95%) |
| SMCI | 200 | $5.00 | 2.25 | $4.00 | $1,000 (1.00%) | +$490 | +$400 | $1,890 (1.89%) |
| TOTAL BOOK | 800 | — | 1.85 Avg | — | $4,000 (4.00%) | +$1,640 (+1.64%) | +$2,000 (+2.00%) | $7,640 (7.64%) |
The Takeaway from the Audit
- The Naive Illusion: Standard calculators display a green light at 4.00% ($4,000)—convincing the trader they still have
1.00%of unused risk capacity below their5.00%ceiling. - The Real Exposure: Because all four tickers belong to the same AI/Semiconductor cluster (ρ = 0.80), carry an average Beta of
1.85, and carry$4.00–$6.00in daily ATR, an overnight shock exposes the account to a 7.64% ($7,640) drawdown. That is 91% more risk than the trader budgeted for—enough to blow through a5.00%prop firm daily loss limit at the opening bell.
What is a safe portfolio heat percentage? The answer depends entirely on whether you trade a personal cash/margin account or operate under proprietary trading firm drawdown constraints.
| Trading Environment / Style | Max Risk Per Trade | Max Naive Heat | Max True Heat (Correlated + Gap) | Why This Ceiling Matters |
|---|---|---|---|---|
|
Prop Firm Evaluation / Funded (Intraday Trailing Drawdown) |
0.25% – 0.50% | 1.25% – 1.50% | 2.00% Max | Intraday high-water marks ratchet your floor upward on unrealized gains; a single correlated pullback terminates the account. |
|
Prop Firm Swing / EOD Drawdown (4%–5% Daily Limit) |
0.50% – 0.75% | 2.00% – 2.50% | 3.50% Max | Keeps a 1.50% safety buffer below the automatic 5.00% daily breach threshold during overnight gaps. |
|
Active Retail Swing Trader (Multi-Sector Cash/Margin) |
1.00% – 1.25% | 4.00% – 5.00% | 6.00% Max | Aligns with Elder’s 6% monthly drawdown ceiling while accounting for realistic ATR slippage. |
|
High-Beta Momentum / Small-Cap (Beta > 2.0) |
0.50% – 1.00% | 2.50% – 3.00% | 4.50% Max |
High-beta names (TSLA, MSTR, crypto proxies) experience nonlinear gap risk that requires smaller share counts.
|
When the calculator above flags a BREACH in red, you do not need to abandon your trade thesis. Apply one of these four quantitative adjustments before the 4:00 PM EST close:
Protocol 1: Enforce the "Max 2 Per Cluster" Rule
Never hold more than two simultaneous swing positions in the same correlation cluster (AI/Semis, Crypto Proxies, Regional Banks, Mega-Cap SaaS). Instead of buying four semiconductor breakouts at 1.0% risk each, pick the two strongest relative-strength leaders (NVDA and AVGO) and discard the laggards.
Protocol 2: Use the Calculator's "Auto-Scale Book" Function
If you want exposure to all four tickers in a theme, you must treat the entire cluster as a single combined position. Clicking the "Auto-Scale Book to Max Heat Limit" button in the tool above automatically scales your share count across every row (for example, trimming each trade from 200 shares to 130 shares) so your True Correlated Gap Heat lands exactly at 5.00% ($5,000).
Protocol 3: Size Stops by Daily ATR, Not Arbitrary Dollar Amounts
Tight stops on high-ATR stocks create a devastating math trap: a tight stop inflates your share count (Shares = Dollar Risk ÷ Stop Distance), and a massive share count multiplies your overnight gap loss when price jumps over your stop. Always cross-check active volatility levels to ensure your stop distance respects the stock's true daily ATR envelope.
Protocol 4: Pair Pre-Trade Heat Audits with a Hard Broker Kill Switch
Calculating portfolio heat before entering a trade protects you from structural over-leverage, but it cannot stop emotional revenge trading when a correlated book stops out at the open. To prevent a bad morning gap from spiraling into an account-ending tilt session, pair your daily portfolio heat audit with an automated, server-side lockout using our blueprint on The Irrevocable Cross Broker Kill Switch.
FAQ Section (Show/Hide)
What is a good portfolio heat percentage for swing trading?
For most independent swing traders managing a personal brokerage account, a maximum True Portfolio Heat between 5.0% and 6.0% (and a Naive Stop Heat of 3.5% to 4.5%) provides the optimal balance between capital growth and drawdown survival. If you trade a funded prop firm account with a 5% daily loss limit, your True Portfolio Heat should never exceed 3.5%.
How is portfolio heat different from position sizing?
Position sizing determines how many shares or contracts to buy on a single trade based on your entry price, stop-loss level, and per-trade risk percentage (typically 0.5% to 1.5% of account equity). Portfolio heat aggregates the combined risk of all open trades simultaneously, factoring in how sector correlations and market beta cause multiple positions to win or lose together.
Does moving a stop-loss to breakeven reduce portfolio heat to zero?
In naive arithmetic calculators, moving your stop-loss to your entry price reduces that position's heat to 0.00%. In real market conditions, a breakeven stop still carries overnight gap heat if held past 4:00 PM EST. If a stock gaps down 2x ATR below your breakeven stop on morning news, you will still suffer negative slippage on the shares held.
Why does high SPY Beta increase my portfolio heat even if my dollar stop is fixed?
While your planned stop-loss distance is fixed under normal intraday liquidity, stocks with a high SPY Beta (β > 1.5) experience disproportionate order-book thinning and wider bid-ask spreads during market-wide sell-offs. Factoring a Beta tail multiplier into your portfolio heat accounts for the higher probability of stop slippage and synchronized momentum unwinds.
About the Author
Tom Edgeworth is the Founder and Lead Quantitative Strategist at SmartEdgeIntel.com, where he builds institutional-grade risk engines, execution frameworks, and weekly index and equity trade plans for independent traders.