You placed your stop loss a few cents below support. You did everything the textbooks said. Then a random Wednesday wiggle — no news, no breakdown, nothing — tagged your stop, and the stock closed at the exact level you were scared of, 20 cents above where you got out. You weren't wrong about the trade. You were wrong about the stop.
Here's the uncomfortable truth most guides won't tell you: "just below support" is not a stop loss strategy — it's a hope. Two traders can both put their stop below the same swing low, one 15 cents down and one 60 cents down, and only one of them actually has a trade. The difference isn't opinion — it's measurable, and the fix is an ATR stop loss: a stop distance sized from the Average True Range.
In this guide you'll learn where to place your stop loss using two layers that work together — structure tells you where, volatility tells you how far — plus a free interactive calculator at the end that does the math for any trade you're considering. Before placing any trade, always check what the market is doing by cecking our SPY Market Regime Tool every morning.
Why "Just Below Support" Gets You Stopped Out
Support and resistance are zones, not hairlines. A swing low that held three times has a width — a band of prices where buyers showed up — and inside that band, price routinely dips below the visible line before recovering. Market makers, algorithms and panic sellers all push into that band. It's where resting orders live, and resting orders get hunted.
When you place your stop 10 or 15 cents below a line you drew with a mouse, you're not placing your stop outside the zone of support. You're placing it inside the zone of normal noise — the everyday fluctuation that happens on any stock, any day, with no information behind it. Statistically, that's the most-likely place for price to touch.
Three failure patterns account for almost every "stopped out right before it reversed" story:
- The hairline stop: placed at the level itself or a few cents beyond, it's filled by the retest that proves support is working.
- The percentage stop: "2% below entry regardless of chart" ignores whether the level is 30 cents or $3 away. Dare to Trade and Investopedia both flag this as the #1 placement error — and they're right, but neither tells you the right distance. This guide does.
- The hope-widened stop: the trader feels the stop is too tight, moves it down "just this once," and converts a planned small loss into an unplanned large one. If a stop feels too tight, the fix is never a wider stop — it's a better entry (see Section 6).
The fix isn't to abandon structure. Support and resistance still decide where your trade idea dies. It's to surround the structure with a buffer sized to the stock's actual daily movement — and that measurement has a name.
The Two-Zone Framework: Structure Sets Where, Volatility Sets How Far
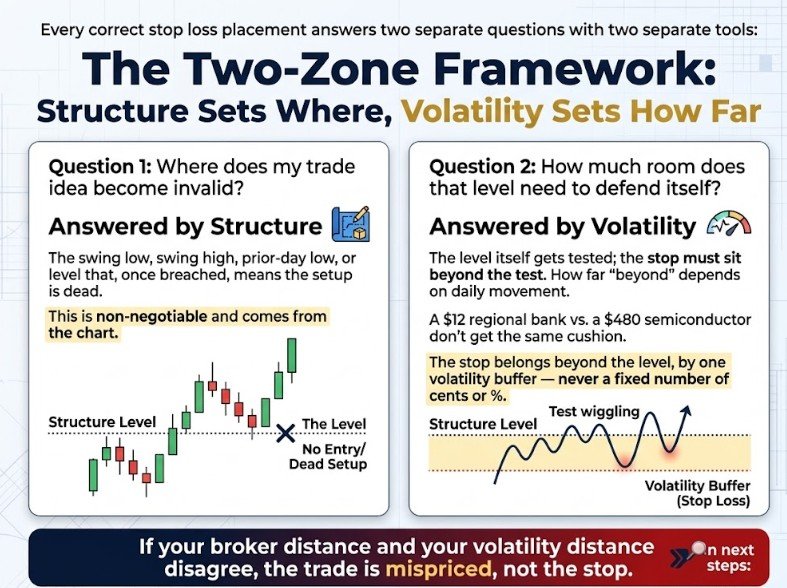
Every correct ATR stop loss answers two separate questions with two separate tools:
Question 1 — Where does my trade idea become invalid? Answered by structure: the swing low, swing high, prior-day low, or level that, once breached, means the setup is dead. This is non-negotiable and comes from the chart.
Question 2 — How much room does that level need to defend itself? Answered by volatility: the level itself gets tested; the stop must sit beyond the test. How far "beyond" depends entirely on how much the stock moves on an ordinary day. A $12 regional bank and a $480 semiconductor don't get the same cushion.
The stop belongs beyond the level, by one volatility buffer — never a fixed number of cents, never a fixed percentage. If your broker distance and your volatility distance disagree, the trade is mispriced, not the stop. Read on for exactly how to measure it.
ATR: The Measure of a Stock's Normal Noise
Average True Range (ATR), developed by J. Welles Wilder in 1978, is the average of a stock's true daily range over the last 14 sessions — how far it actually traveled, gaps included. If a stock's 14-day ATR is $1.15, that stock moves about $1.15 a day as a matter of routine, with no news and no breakdown. That number is your noise budget.
One number does three jobs in ATR stop loss placement:
- The buffer: a stop placed at the structure level ± 1× ATR sits outside ordinary daily wiggle. Active traders commonly use 1×–2× ATR for swing positions and 0.5×–1× ATR (or intraday ATR) for day trades.
- The sanity check: divide your total stop distance by ATR. The result — stop distance in ATR multiples — tells you whether the trade is structurally sound (see the zones below).
- The size lever: risk stays fixed, so a wider volatility stop automatically means a smaller share count. Volatility never increases your risk here — it redistributes it.
The Three ATR Zones
Once you compute stop distance ÷ ATR, every trade lands in one of three zones:
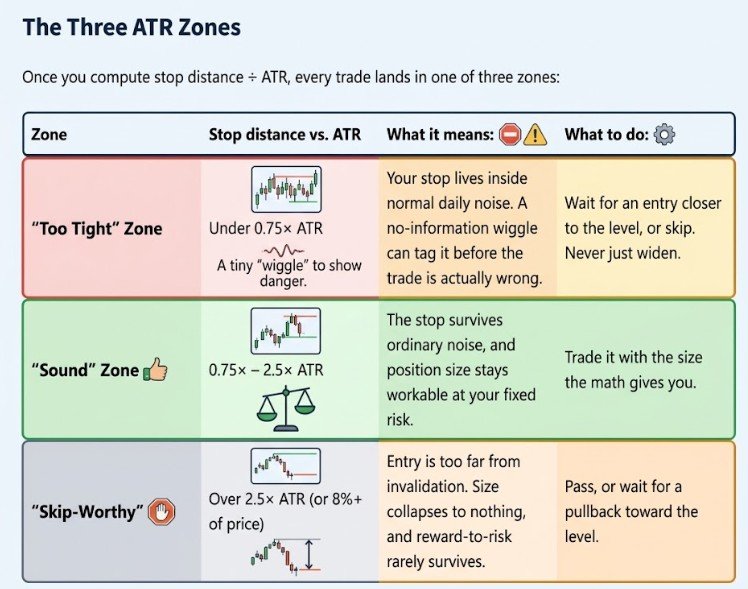
| Zone | Stop distance vs. ATR | What it means | What to do |
|---|---|---|---|
| Too Tight | Under 0.75× ATR | Your stop lives inside normal daily noise. A no-information wiggle can tag it before the trade is actually wrong. | Wait for an entry closer to the level, or skip. Never just widen. |
| Sound | 0.75× – 2.5× ATR | The stop survives ordinary noise, and position size stays workable at your fixed risk. | Trade it with the size the math gives you. |
| Skip-Worthy | Over 2.5× ATR (or 8%+ of price) | Entry is too far from invalidation. Size collapses to nothing, and reward-to-risk rarely survives. | Pass, or wait for a pullback toward the level. |
The zone test is the quantitative answer the other guides skip: how far below support isn't a matter of feel — it's a ratio you can compute in five seconds.
Interactive: The ATR Stop Placement Calculator
Use the calculator below on any trade you're contemplating. Enter your entry, your structure level, the stock's 14-day ATR (your charting platform shows it, or use any free ATR quote), and your fixed dollar risk per trade. It returns the recommended stop, the stop distance in ATR multiples, the exact share size that keeps your risk fixed, and a verdict from the three zones above.
ATR Stop Placement Calculator
Structure sets where your stop goes. ATR tells you if the level gives it enough room to survive.
Educational tool only — not financial advice. ATR = 14-period Average True Range, daily chart. Rule of thumb: a stop under ~0.75× ATR is inside the noise band; over ~2.5× ATR usually means the entry is too far from structure. If the level can't defend a survivable stop, the trade is a skip — not a wider stop.
Try the worked example below, then load one of your own live setups into it — the verdict usually tells you something you didn't want to hear. That's the point.
Worked Example: A $150 Risk Trade, Step by Step
Suppose a stock is setting up long off a well-tested swing low at $47.00. Your planned entry is $48.20 on a breakout retest. The 14-day ATR is $1.15, and your account risk per trade is $150.
- Buffer the level: $47.00 − (1.0 × $1.15) = stop at $45.85. The stop is anchored to the structure, not to the entry.
- Measure the distance: $48.20 − $45.85 = $2.35 per share.
- Run the zone test: $2.35 ÷ $1.15 = 2.0× ATR — inside the Sound zone. The level can defend this trade.
- Size from the distance: $150 ÷ $2.35 = 63 shares. Actual risk: 63 × $2.35 = $148.05.
Now rerun the same trade with a lazy hairline stop at $46.85 — fifteen cents under support. Distance: $1.35, which is 1.2× ATR… except it sits only 17 cents beyond the level, inside the test zone, and the calculator's buffer logic flags it. Same chart, same conviction — but one stop placement turns a survivable trade into a coin flip, and the other one pays you for being wrong slowly instead of instantly.
The Skip Rule: When the Level Can't Defend a Survivable Stop
Here's the rule that separates this framework from every "place your stop below support" article on the internet:
If the structure level cannot defend a stop that survives the noise band, the trade is a skip — not a wider stop.
When your entry sits far above the protecting level, every attempt to rescue the trade makes it worse. Widen the stop and share size collapses, so a 2R target barely pays; keep size and your planned risk doubles or triples; move the stop inside the noise band and you pay the noise tax you came here to avoid. The entry is the broken component — not the stop.
Practically, that means three good outcomes and one bad one. Good: the pullback comes and gives you an entry near the level, so the distance shrinks and size comes up. Good: you skip and your capital is whole. Good: you take the smaller size knowingly, with the math on paper. Bad only: you enter far from structure, widen the stop once the trade wobbles, and turn a $150 plan into a $400 accident. The calculator's red verdict exists precisely to make that last path impossible to take by surprise. The widening habit is rarely math — it's emotion wearing math's clothes. If you notice you're hunting reasons to stretch stops after a loss, that tilt is the actual trade you're losing; the revenge trading tilt calculator
makes the compounding cost of it impossible to unsee.
Quick Rules to Lock the Framework In
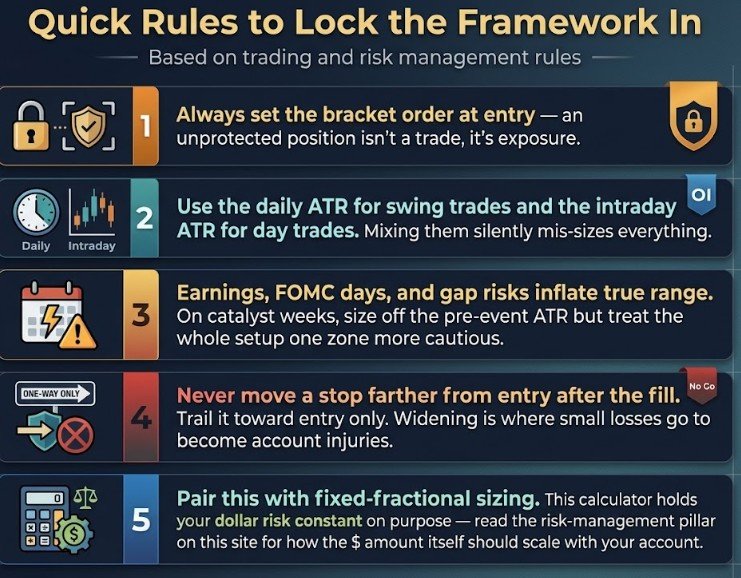
- Always set the bracket order at entry — an unprotected position isn't a trade, it's exposure.
- Use the daily ATR stop loss for swing trades and the intraday ATR stop loss for day trades. Mixing them silently mis-sizes everything.
- Earnings, FOMC days, and gap risks inflate true range. On catalyst weeks, size off the pre-event ATR but treat the whole setup one zone more cautious.
- Never move a stop farther from entry after the fill. Trail it toward entry only. Widening is where small losses go to become account injuries.
- Pair this with fixed-fractional sizing. This calculator holds your dollar risk constant on purpose — and when you run multiple positions, the portfolio heat calculator keeps your total open risk across all trades inside one account-level budget.
- Funding traders: an ATR-sized stop only helps if it fits your evaluation's loss limits — the prop firm risk calculator sizes the trade against max drawdown rules before you place it, not after a violation email.
Beyond the support level by at least one ATR (14-day Average True Range). A stop closer than about 0.75× ATR from your entry lives inside the stock's normal daily noise and can be triggered before the trade is genuinely wrong. The exact distance is structure level minus (ATR × your buffer), and your entry-to-stop distance should land between roughly 0.75× and 2.5× ATR for the trade to be workable.
Day traders typically use 0.5×–1× of the intraday range; swing traders commonly use 1×–2× the daily ATR. Higher-volatility stocks and catalyst weeks argue for the upper end — but if the required buffer pushes your total stop distance beyond about 2.5× ATR, the honest conclusion is that your entry is too far from structure, and the trade should be skipped rather than the stop stretched.
Because a stop placed a few cents beyond a drawn line sits inside the zone where price routinely tests the level. That test is the support working, not failing. The fix is a volatility buffer: place the stop at the level minus one ATR so ordinary noise can't reach it, and accept that the wider stop requires a proportionally smaller position so your dollar risk stays identical.
No — not if you size correctly. Dollar risk equals shares times stop distance. Double the stop distance and halve the share count, and your planned loss at the stop is exactly the same dollars. The calculator above does this automatically: fixed dollar risk in, share count out. This is the core of fixed-fractional position sizing.
Yes. ATR is a distance measure, so the framework ports to any instrument that has one — options by converting the underlying's ATR into expected premium movement (roughly, premium moves with underlying delta × ATR), futures and crypto directly from their own daily ATR. The zone logic (too tight / sound / skip-worthy) is identical; only the price feed changes.
The Bottom Line
Your support level told the truth. Your stop was just standing in the noise when it was tested. Structure says where the trade idea dies; ATR stop loss says how much room that level deserves; fixed-fractional sizing makes the wider stop cost you nothing extra. Run every planned trade through the ratio before the order, not after the stop-out — and when the ratio says skip, treat skipping as the trade you took correctly.
This article is for education only and is not financial advice. All examples are hypothetical.