
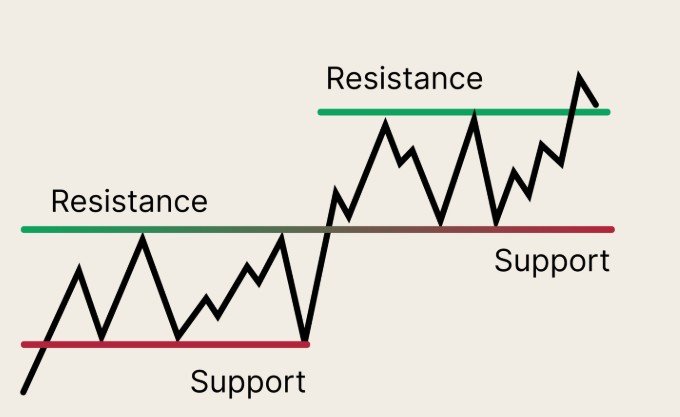
Support and resistance are the most fundamental concepts in technical analysis, representing price levels where buying or selling pressure creates predictable market behavior. Furthermore, mastering these levels transforms random price action into readable patterns that reveal high-probability trading opportunities.
What Are Support and Resistance?
Support acts as a floor where buying pressure prevents prices from falling further. Conversely, resistance acts as a ceiling where selling pressure stops prices from rising higher. These levels guide entry, exit, and risk management decisions across all trading strategies.
Price tends to reverse or pause at support and resistance because these zones represent areas where traders cluster orders. Therefore, when price approaches a well-established level, the collective behavior of thousands of traders creates predictable reactions. Additionally, institutional algorithms often place significant orders at these psychological levels.
Why Support and Resistance Work
The strength of support and resistance levels depends on historical price behavior and market psychology. Repeated tests of a level increase its significance because each touch confirms that market participants respect that price zone. Moreover, high trading volume at specific levels validates their importance.
Support tends to hold better during uptrends while resistance proves stronger in downtrends. Meanwhile, round numbers like $50, $100, or $1,000 often become powerful psychological levels where traders naturally place orders. Consequently, these zones become self-fulfilling prophecies as more traders watch them.
How to Identify Support and Resistance Levels
Historical Price Action Method
Look for past price reversals or consolidation zones where price repeatedly bounced. Identify the extreme highs and lows that form boundaries of your trading range. Focus on areas with frequent touches and high trading volume as these indicate stronger levels.
Pay attention to where strong price rejection occurred, especially candlesticks with long wicks showing rejection. Similarly, consolidation patterns reveal zones where buyers and sellers reached temporary equilibrium. These historical areas often continue to influence future price behavior.
Using Technical Indicators
Moving averages act as dynamic support during uptrends or resistance in downtrends. The 50-day and 200-day moving averages are particularly powerful because institutions track them closely. Furthermore, Bollinger Bands highlight potential breakout points based on market volatility.
Trend lines connect at least two significant swing points to establish the trend’s slope. In uptrends, draw trend lines connecting higher lows to identify support. Conversely, in downtrends, connect lower highs to find resistance. Remember that trend lines are zones rather than exact prices.
Multiple Timeframe Analysis
The most reliable support and resistance levels appear across multiple timeframes. Start by identifying major levels on daily or weekly charts, then zoom into shorter timeframes for precise entry timing. Levels that hold significance across various time periods carry more weight.
When a support or resistance zone aligns on 4-hour, daily, and weekly charts simultaneously, the probability of a reaction increases dramatically. Therefore, always confirm your levels by checking at least three different timeframes before taking trades.
Support and Resistance Trading Strategies
Range Trading Strategy
Range trading involves buying near support and selling near resistance in sideways or non-trending markets. First, identify the extreme highs and lows forming your range boundaries. Next, wait for price to reach support with a bullish confirmation candle before entering long.
Similarly, sell when price touches resistance with a bearish confirmation candle. Place stop losses 5-10 pips below support for long positions or 5-10 pips above resistance for short positions. Target the opposite side of the range for your profit objective, creating favorable risk-reward ratios.
Breakout Trading Strategy
The breakout strategy involves trading when price moves decisively through a support or resistance zone. A breakout indicates a significant change in the balance between supply and demand. Enter after price closes beyond the level with strong volume confirmation.
Wait for a retest of the broken level where old resistance becomes new support or vice versa. This retest provides a second-chance entry with better risk-reward since you can place stops just beyond the breakout point. Trade in the direction of the dominant trend for highest success rates.
Set stops below the breakout candle for long positions or above for short positions. Target the next major support or resistance level, which often equals the height of the previous range projected from the breakout point. Monitor for volume surges during breakouts as low-volume breaks frequently fail.
Bounce Strategy in Trending Markets
In trending markets, support and resistance behave differently than in ranges. During uptrends, focus on recent swing lows that often become support levels. Meanwhile, in downtrends, recent swing highs frequently become resistance zones.
Buy pullbacks to support in established uptrends rather than trying to catch falling knives. First, confirm the overall trend direction using higher timeframe analysis. Next, wait for price to pull back to a key support level with declining momentum. Finally, enter when price shows rejection with a strong bullish candle closing away from support.
Combining RSI with Support and Resistance
The Relative Strength Index (RSI) measures price momentum and works powerfully alongside support and resistance. When price approaches support and RSI falls into oversold territory below 30, buying pressure often emerges for high-probability long entries.
Conversely, when price reaches resistance and RSI shows overbought readings above 70, it suggests weakening momentum and potential reversal opportunities. This confluence of technical factors dramatically improves entry timing and reduces false signals. Always wait for both price action confirmation at the level and RSI confirmation before entering.
Drawing Support and Resistance Zones
Think in Zones, Not Lines
Professional traders view support and resistance as zones rather than exact price lines. Market price rarely respects precise levels down to the penny. Instead, create zones that encompass multiple touches and account for wicks that slightly penetrate levels.
Adjust your zones to include as many significant touches as possible without making them so wide they lose meaning. A zone of 0.5-1% around a level typically works well for stocks, while forex pairs may need tighter zones of 10-20 pips. The key is capturing the area where order flow clusters.
Identifying Major vs Minor Levels
Not all support and resistance levels carry equal importance. Major levels show multiple tests over extended periods, often months or years. These levels appear across multiple timeframes and typically involve round psychological numbers.
Minor levels may provide temporary support or resistance but break more easily under pressure. Focus your trading attention on major levels where the probability of significant reactions increases. Internal levels within ranges exist but are typically less significant than range boundaries.
Drawing Trend Channels
In addition to horizontal support and resistance, use sloping trend lines to create trend channels. Connect at least two swing points to establish the trend’s slope. Not every touch will be perfect since trend lines are also zones rather than exact lines.
Draw the primary trend line first, then create a parallel channel line on the opposite side. Price often oscillates between channel boundaries, providing trading opportunities at each touch. When price breaks the channel, it signals potential trend changes or acceleration.
Common Support and Resistance Mistakes
Many beginners draw too many levels, creating cluttered charts that provide no clear guidance. Similarly, treating levels as exact prices rather than zones leads to premature entries or exits when price slightly penetrates a level. Instead, focus on the most obvious major levels that price has tested multiple times.
Another critical error involves ignoring the broader trend context. Trading against the dominant trend at minor support or resistance levels results in frequent stop-outs. Therefore, always align your support and resistance trades with higher timeframe trends for maximum probability.
Traders also make the mistake of entering immediately when price touches a level without waiting for confirmation. Price often wicks through levels before reversing, triggering stops on premature entries. Wait for confirmation candles that show rejection before executing trades at support or resistance.
Advanced Support and Resistance Concepts
Role Reversal Phenomenon
Old support often becomes new resistance after being broken, and old resistance frequently transforms into new support. This role reversal occurs because these levels represent significant price memory where traders who missed the initial move place orders. The principle works exceptionally well in second-chance breakout scenarios.
When price breaks above resistance, wait for it to pull back and retest that level as new support before entering. This retest provides confirmation that the breakout is legitimate and offers a lower-risk entry point. The same principle applies in reverse for broken support becoming new resistance.
Confluence Zones
The most powerful trading setups occur where multiple forms of support or resistance converge. For example, when a horizontal support level aligns with an upward trend line and the 200-day moving average simultaneously, that confluence zone has exceptionally high probability of holding.
Look for areas where Fibonacci retracement levels, pivot points, moving averages, and historical price levels cluster together. These confluence zones provide the highest probability trades because multiple technical factors reinforce the same price level. Additionally, place your largest position sizes at confluence zones where conviction is highest.
Practical Tips for Trading Success
Start by identifying support and resistance on clean charts without excessive indicators cluttering your view. Mark only the most obvious levels where price has clearly reacted multiple times. Focus on quality over quantity when selecting which levels to trade.
Always combine support and resistance analysis with proper risk management principles. Never risk more than 1-2% of your account on any single trade, regardless of how strong a level appears. The best technical analysis means nothing without disciplined position sizing.
Practice drawing support and resistance levels on historical charts to develop pattern recognition skills before risking real capital. Additionally, keep a trading journal documenting which types of support and resistance setups work best for your style. Over time, you’ll discover which specific configurations offer your highest win rates.
Support and resistance provide the foundation for virtually every successful trading strategy across all markets and timeframes. Master these concepts to read price action with clarity and confidence.

Leave a Reply