Table of Contents
Quick Jump Table of Contents
- 01. The Intraday High-Water Ratchet (Apex & Tradeify Style)
- 02. End-of-Day (EOD) Trailing Drawdown (Topstep Style)
- 03. When Does the Trailing Stop?
- 04. The Mathematical Formula for the Consistency Cap
- 05. The 30% Consistency Rule Example
- 06. Enforcing the Upper Ceiling with an Automated Kill Switch
- 07. Prop Firm Calculator FAQ
Why You Need a Prop Firm Risk Calculator: The Dual-Boundary Trap
If you ask a futures trader why they failed their latest funded evaluation, they will usually blame a sudden market reversal or slippage on NQ.
In institutional proprietary trading, that is rarely the real reason.
Traders do not fail funded evaluations because their edge disappeared—they fail because retail prop firms subject accounts to a dual-boundary mathematical trap. While your charting platform displays standard price action, your broker gateway is actively enforcing two opposing invisible ceilings and floors:
- The Lower Boundary (The Trailing Floor): An intraday high-water mark that ratchets upward on unrealized, floating gains—permanently trapping your liquidation threshold higher even if the market pulls back.
- The Upper Boundary (The Consistency Cap): A strict single-day profit ceiling (typically 20%, 30%, or 50% of total profit) where an oversized winning trade disqualifies you from payouts and forces you to grind thousands in extra profit across extra trading days.
The moment you cross either boundary, the firm terminates your account or locks your withdrawal.
Use the Smart Edge Intel Prop Firm Dual-Boundary Simulator below to stress-test your open session, compute your remaining cushion, and discover the exact dollar profit level where you must walk away from the screens.
To survive a prop firm evaluation or performance account (PA), you must understand the rules of the risk engine monitoring your fills. Prop firms use two distinct drawdown mechanisms:
To survive a prop firm evaluation or performance account (PA), you must understand the rules of the risk engine monitoring your fills. Prop firms use two distinct drawdown mechanisms:
The Intraday High-Water Ratchet (Apex & Tradeify Style)
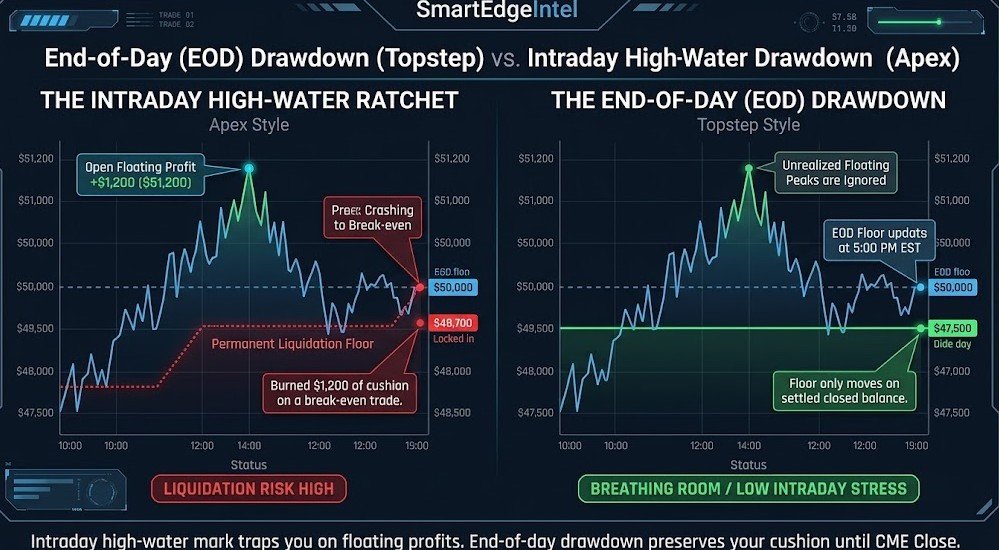
Under an Intraday Trailing Drawdown, the liquidation floor tracks your account equity tick-by-tick.
Crucially, it measures unrealized floating open equity, not closed trades:
- You start a
$50,000account with a$2,500maximum trailing drawdown. Your initial liquidation floor is$47,500. - You buy 2 NQ contracts. The trade runs in your favor to +$1,200 open floating profit. Your account touches
$51,200. - The prop firm’s risk engine instantly moves your trailing floor up to:
$51,200 − $2,500 = $48,700 - You decide not to take profit, hoping for a runner. The market abruptly rejects resistance and reverses back to your entry price. You exit at
$50,000(break-even). - The Reality: Your account balance is
$50,000, but your liquidation floor is now permanently locked at$48,700. You just burned $1,200 of your risk cushion on a break-even trade.
This is why Monte Carlo simulations show that an intraday trailing drawdown reduces a profitable trader's statistical odds of passing an evaluation by nearly 18% compared to a static risk model.
End-of-Day (EOD) Trailing Drawdown (Topstep Style)
Under an End-of-Day (EOD) Drawdown, your liquidation floor updates only once per day—at the official CME market close (5:00 PM EST).
If a trade runs up +$1,500 intraday and pulls back to scratch, your floor does not ratchet upward during the trading session. Your liquidation threshold updates based strictly on realized, settled balance at the end of the day. This structure provides breathing room for trend traders and multi-contract runners.
When Does the Trailing Stop?
In major firms like Apex Trader Funding, Topstep, and Tradeify, the trailing floor stops following your account once it reaches Starting Balance + $100 (e.g., $50,100 on a $50k account). Once your floor locks at this threshold, you enter a static risk environment where profits accumulate without raising your liquidation floor.
Passing the evaluation is only the first hurdle. The most common reason funded traders are denied their first payout is the Consistency Rule.
Prop firms enforce consistency rules (typically 20%, 30%, or 50%) to filter out "one-hit wonders"—gamblers who full-margin 5 NQ contracts into a high-impact U.S. Bureau of Labor Statistics (BLS) CPI release and pass in twenty minutes.
The Mathematical Formula for the Consistency Cap
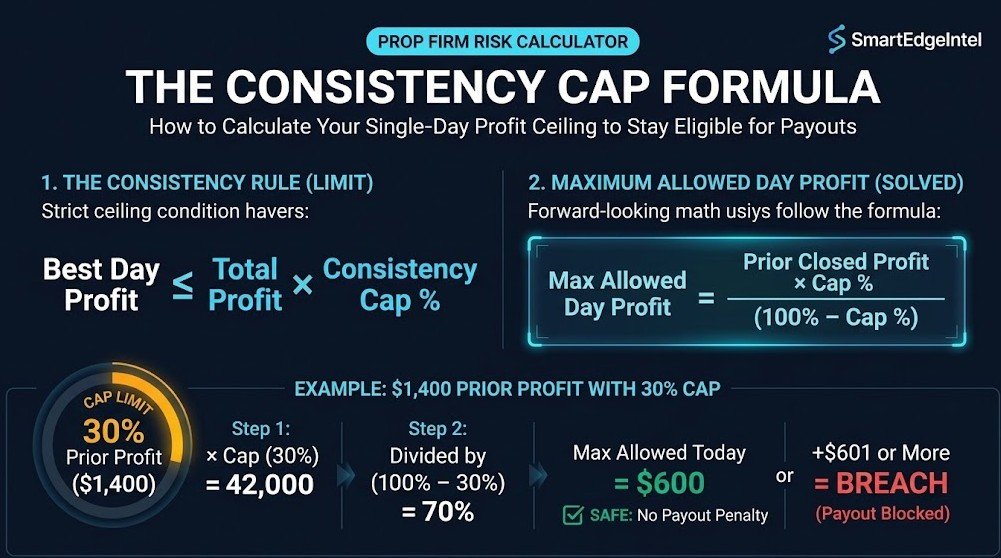
Prop firm consistency rules dictate that no single trading day can account for more than a specific percentage of your total accumulated profit at the time of your withdrawal request:
The 30% Consistency Rule Example
Suppose you trade a funded account with a 30% Consistency Rule. Over your first 4 trading days, you steadily accumulated $1,400 in closed profits.
On Day 5, you catch a clean trend day and find yourself up $1,500 on the session:
- Your new total accumulated profit is:
$1,400 + $1,500 = $2,900 - Today's profit percentage of your total book is:
$1,500 ÷ $2,900 = 51.7% - The Trap: You have breached the 30% ceiling. Your firm will not approve a payout. To make your
$1,500day compliant with the 30% rule, you are forced to trade until your total account profit reaches:$1,500 ÷ 0.30 = $5,000You must now generate an extra $2,100 in profit without touching your trailing floor before you can withdraw a single dollar.
The Solution: Use the simulator above to monitor your Daily Consistency Ceiling. When your session approaches within $100 of that ceiling, stop trading immediately.
Standard fixed-contract sizing leads to account liquidation inside trailing corridors. If you trade 2 mini NQ contracts when your cushion is $2,500, you have a comfortable 62.5-point buffer. If you trade those same 2 mini NQ contracts after an intraday pullback has narrowed your cushion to $800, a normal 20-point noise wick liquidates your account.
Use this institutional corridor allocation formula before submitting an order:
| Remaining Trailing Cushion | Permitted Trade Risk (Max 35%) | Recommended Instrument | Max Stop Distance | Tactical Action |
| $2,000 – $2,500+ | $700 – $875 | 1 – 2 Mini (NQ) | 35 – 40 pts | Standard A+ setup execution; trail stops behind structural swings. |
| $1,200 – $1,999 | $420 – $700 | 1 Mini (NQ) or 5 Micro (MNQ) | 25 – 30 pts | Eliminate discretionary scaling; scale out 50% at 1:1 R:R. |
| $600 – $1,199 | $210 – $420 | 2 – 4 Micro (MNQ) | 25 – 35 pts | Ban Mini contracts. Switch exclusively to Micros to prevent tick-slippage liquidation. |
| Under $600 | $100 – $200 | 1 – 2 Micro (MNQ) | 20 – 25 pts | Defend survival floor. Focus solely on high-conviction intraday scalps. |
To manage total exposure across swing trades and overnight holds, audit your open risk with our True Portfolio Heat & Gap Stress-Test Calculator
alongside this prop firm risk calculator.
Enforcing the Upper Ceiling with an Automated Kill Switch
Knowing your numbers mathematically is meaningless if you lack execution discipline when euphoria sets in. When your session hits its daily consistency cap, emotional momentum often tempts traders into "one more scalp"—which turns into a giving-back cycle that pulls back and ratchets the trailing floor higher.
To eliminate this behavioral failure point, lock in your day by pairing this prop firm risk calculator with the hardware and platform-level protocols outlined in The Irrevocable Cross Broker Kill Switch.
Prop Firm Calculator FAQ
Q1 Does unrealized profit count against the trailing drawdown in Apex?
Q2 What happens if I make too much money and violate the consistency rule?
Q3 How does Topstep's trailing drawdown differ from Apex's?
Q4 When does a prop firm trailing drawdown stop trailing?
Tom Edgeworth is the Founder and Lead Quantitative Strategist at SmartEdgeIntel.com, specializing in algorithmic execution guardrails, prop firm risk corridors, and quantitative volatility analysis for active futures and options traders.