
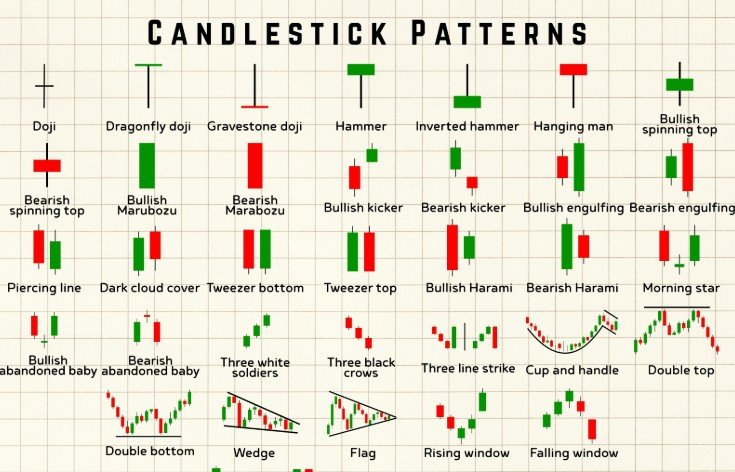
Candlestick patterns trading reveals market psychology through visual price action that shows the battle between buyers and sellers. Furthermore, each candlestick displays four critical data points—open, high, low, and close—in a single graphic element that makes technical analysis faster and more intuitive.
Anatomy of a Candlestick
Every candlestick has a body and wicks, also called shadows. The body represents the range between open and close prices during the specified timeframe. Meanwhile, the wicks show the high and low prices reached during that period.
A green or white candlestick means the close was higher than the open, indicating buyers won that period. Conversely, a red or black candlestick means the close was lower than the open, showing sellers had control. The color instantly tells you who dominated the trading session.
Body Size Reveals Conviction
Large bodies show strong conviction in one direction, while small bodies suggest indecision or balance between buyers and sellers. Therefore, body size becomes just as important as color when analyzing candlestick patterns trading setups. Additionally, the body-to-wick ratio provides clues about intraday volatility and rejection levels.
Wick Length Shows Rejection
Long upper wicks indicate sellers rejected higher prices and pushed them back down. Similarly, long lower wicks show buyers rejected lower prices and defended that level. Consequently, wicks act as early warning signals for support and resistance zones before they become obvious.
Single Candlestick Patterns
Hammer Pattern
The hammer has a small body at the top and a long lower wick at least twice the body length. This pattern appears at the bottom of downtrends when sellers push prices lower but buyers aggressively reject those levels. As a result, the hammer signals potential bullish reversals with high reliability when confirmed by the next candle.
Shooting Star Pattern
The shooting star is the bearish opposite of the hammer, featuring a small body at the bottom with a long upper wick. This occurs at the top of uptrends when buyers push higher but sellers overwhelm them and drive prices back down. Therefore, shooting stars warn that the uptrend may be exhausted and ready to reverse.
Doji Pattern
A doji forms when open and close prices are virtually identical, creating little to no body. The doji signals indecision and equilibrium between buyers and sellers. However, dojis become powerful reversal signals when they appear after extended trends, indicating momentum exhaustion.
Marubozu Pattern
A marubozu has virtually no wicks—just a large body showing complete dominance by one side. Bullish marubozu candles indicate strong buying throughout the entire session with success rates of 65-70% in trending conditions. Conversely, bearish marubozu patterns show uninterrupted selling pressure from open to close.
Dual Candlestick Patterns
Bullish Engulfing Pattern
The bullish engulfing pattern consists of a small red candle followed by a large green candle that completely covers the previous body. This pattern appears after downtrends and signals that bulls have seized control. Furthermore, the larger the engulfing candle relative to the first, the stronger the reversal signal becomes.
Bearish Engulfing Pattern
The bearish engulfing pattern is the opposite—a small green candle followed by a large red candle that engulfs it. This pattern occurs at the top of uptrends, indicating bears have taken control and a downward move may follow. Volume confirmation significantly increases the reliability of engulfing patterns.
Piercing Line Pattern
The piercing line has a long red candle followed by a long green candle that opens lower but closes more than halfway up the first candle’s body. This demonstrates strong buying pressure overcoming initial selling. Therefore, piercing lines suggest bullish reversals are developing after downtrends.
Dark Cloud Cover Pattern
Dark cloud cover is the bearish version where a green candle is followed by a red candle that opens higher but closes more than halfway down the first body. This pattern signals that sellers are overwhelming buyers at resistance levels. Watch for this setup at the end of uptrends for potential short opportunities.
Triple Candlestick Patterns
Morning Star Pattern
The morning star uses three candles—a long red candle, a small-bodied candle showing indecision, and a long green candle closing well into the first candle’s body. This pattern marks potential market bottoms after downtrends. Moreover, the middle candle can be any color since it represents the transition from selling to buying pressure.
Evening Star Pattern
The evening star is the bearish counterpart with a long green candle, an indecision candle, and a long red candle. This appears at market tops and signals potential reversals downward. The pattern shows buyers losing control as sellers begin dominating the price action.
Three White Soldiers
Three white soldiers consists of three consecutive green candles with small wicks, each opening within the previous body and closing higher. This pattern indicates strong bullish momentum building after downtrends. Additionally, consistent higher closes demonstrate persistent buying pressure that often continues.
Three Black Crows
Three black crows features three consecutive red candles, each opening within the previous body and closing lower. This bearish pattern signals strong selling momentum and potential trend reversals from bullish to bearish. The pattern becomes more reliable when it appears after extended uptrends near resistance.
Continuation Patterns
Rising Three Methods
The rising three methods shows a long green candle followed by three smaller red candles that stay within the first candle’s range, then a final green candle closing above everything. This five-candle pattern confirms the uptrend will continue after a brief consolidation. Consequently, it provides low-risk entry opportunities within established trends.
Falling Three Methods
The falling three methods is the bearish version with a long red candle, three small green candles within its range, and a final red candle closing below. This pattern validates downtrend continuation after temporary pullbacks. Smart traders use these setups to add to short positions with favorable risk-reward ratios.
Trading Candlestick Patterns Successfully
Confirm with Volume
High volume on reversal patterns significantly increases their reliability. For example, bullish engulfing patterns with volume exceeding 120% of the 20-day average show institutional participation. Therefore, always check volume analysis before taking candlestick pattern trades.
Consider Market Context
Candlestick patterns trading works best when aligned with the broader trend and at key support or resistance levels. Additionally, patterns appearing at the end of extended moves carry more weight than those in the middle of ranges. Never trade patterns in isolation without considering overall market structure.
Use Proper Entry and Exit Rules
Enter candlestick pattern trades 0.1-0.3% above the pattern high for bullish setups or below the pattern low for bearish setups. Moreover, place stops just beyond the opposite end of the pattern to limit risk. Target at least a 2:1 reward-to-risk ratio by measuring to the next significant structure level.
Common Candlestick Trading Mistakes
Many beginners trade every pattern they see without considering timeframe or confirmation. Similarly, ignoring the preceding trend leads to taking reversal patterns in the middle of consolidations where they have low success rates. Instead, focus on patterns that align with higher timeframe trends and occur at logical reversal zones.
Another critical error involves using candlestick patterns on low-liquidity stocks or during low-volume periods. These situations generate false signals that trigger stops. Therefore, trade candlestick patterns on liquid instruments during active market hours for best results.
Candlestick patterns trading provides a universal language for understanding price action across all markets and timeframes. Master these setups to identify high-probability entries and exits with precision timing.

Leave a Reply