
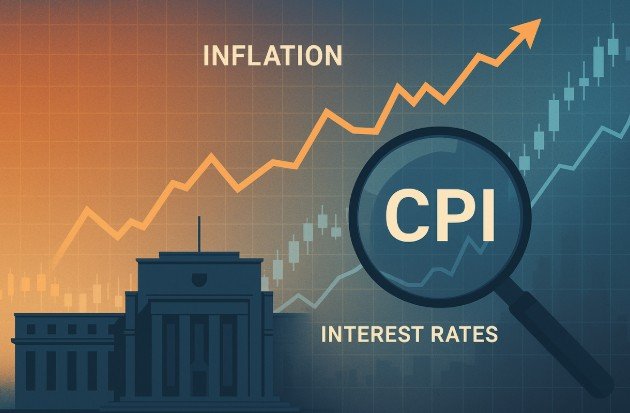
CPI report trading involves strategically positioning trades around the monthly Consumer Price Index release, one of the most volatile and tradeable economic events. Furthermore, understanding how markets react to inflation data transforms this high-impact release into consistent profit opportunities when approached systematically.
What Is the CPI Report and Why Does It Move Markets?
The Consumer Price Index measures the average change in prices consumers pay for goods and services. Released monthly by the Bureau of Labor Statistics, it serves as the Federal Reserve’s primary gauge for inflation—and the Fed’s decisions on interest rates directly impact stock prices, bond yields, and currency values. Consequently, CPI data creates immediate and significant market movements across all asset classes.
Traders care about CPI because it drives monetary policy expectations. Lower inflation increases the likelihood of Fed rate cuts, which typically boosts stocks and bonds. Meanwhile, higher-than-expected inflation suggests the Fed might maintain hawkish policy longer, often triggering selloffs in risk assets. These predictable cause-and-effect relationships create tradeable opportunities for prepared traders.
The report includes headline CPI and core CPI figures. Headline CPI measures all consumer goods including volatile food and energy prices. Core CPI excludes food and energy, providing a clearer picture of underlying inflation trends. The Federal Reserve focuses primarily on core CPI when making policy decisions because it better reflects persistent inflationary pressures rather than temporary price spikes.
Key Components Traders Must Watch
Interest Rate Expectations
Lower inflation equals higher chance of Fed rate cuts, which typically causes stocks to rally. Higher inflation often means the Fed stays hawkish longer, pressuring equity prices downward. Additionally, bond yields move inversely—falling with rate cut expectations and rising with hawkish inflation data. Smart traders position accordingly before releases based on consensus estimates.
Sector Rotation
Inflation data triggers moves between growth stocks, value stocks, and bonds. When services inflation accelerates while goods inflation cools, it signals shifting economic dynamics that create opportunities across multiple asset classes. Therefore, understanding which sectors benefit from different inflation scenarios provides trading edges beyond simple long or short positions.
Volatility Spikes
CPI release days often see 2-3x normal trading volume in the first 30 minutes. Markets can move 1-2% on major indices within minutes of the release. This volatility creates both opportunities and risks that require specific preparation and execution strategies. Moreover, options premiums expand dramatically before CPI releases, affecting strategies for options traders.
Pre-Release Trading Setup
Mark Key Liquidity Levels
Identify and mark liquidity levels 15-30 minutes before the 8:30 AM ET release. Focus on previous session highs and lows, overnight range boundaries, and major support and resistance levels. These zones contain clusters of orders that price will likely target during the initial reaction volatility.
Additionally, note unfilled gaps and significant swing points from the previous week. Professional traders anticipate that CPI volatility will sweep these levels to grab liquidity before establishing the true directional move. Understanding this manipulation phase prevents getting stopped out on the initial whipsaw.
Analyze Consensus Expectations
Check the consensus forecast compared to the previous month’s reading. When economists expect significant changes from prior data, markets typically price in some anticipation before the release. Consequently, the actual reaction depends more on beating or missing expectations than the absolute inflation number itself.
Pay attention to whisper numbers—unofficial expectations circulating among professional traders that sometimes differ from published consensus. Major divergence between whisper numbers and official consensus can create outsized reactions when data confirms one expectation over the other. Therefore, monitoring professional trading communities provides valuable insight beyond mainstream forecasts.
Set Up Technical Indicators
Configure charts with moving averages showing the 9, 20, and 50-period EMAs on 5-minute and 15-minute timeframes. These help identify immediate trend direction after the release and provide dynamic support/resistance for entry refinement. Furthermore, add Bollinger Bands to visualize volatility expansion and potential reversal zones.
Use RSI and MACD on 5-minute charts to gauge momentum sustainability after the initial spike. Often, the immediate reaction creates overbought or oversold conditions that reverse within 15-30 minutes. Spotting these exhaustion signals early improves entry timing and risk-reward ratios significantly.
The 15-Minute Reaction Strategy
The most reliable CPI report trading approach involves watching the initial 15-minute candle after the 8:30 AM ET release. This candle often establishes the bias for the entire session. Historical data shows strong correlations between the first 15-minute reaction direction and the day’s closing direction for many instruments.
After noting whether the initial reaction is green or red, check historical correlation data for your specific trading instrument. Different assets show varying probabilities of following through or reversing after CPI data. For example, certain indices consistently continue in the direction of the initial reaction, while others frequently reverse.
Use this probability data to set your trading bias for the session rather than trading emotionally. If your instrument shows a 67% probability of following through after a red initial reaction, that statistical edge justifies bearish positioning for the day. Conversely, instruments with low correlation to initial reactions require different strategies focused on fading the move.
Wait for the initial volatility to settle before entering positions. The first 5-10 minutes typically involve erratic price action as algorithms process the data and liquidity gets absorbed. Trading this chaos leads to poor fills and whipsaw losses. Instead, patience during the initial spike improves execution quality dramatically.
Immediate Reaction Trades
Breakout Strategy
Place buy stop orders above key resistance and sell stop orders below support levels identified during pre-market analysis. When CPI data creates strong directional conviction, price often breaks these levels decisively within the first 30 minutes. These breakout trades capture the momentum move when inflation surprises significantly beat or miss expectations.
Use OCO (One Cancels Other) orders to simultaneously place both buy and sell orders, with one automatically canceling when the other fills. This approach ensures you catch the breakout direction without predicting which way price will move. Additionally, set stops just beyond the opposite end of your marked range to limit risk if the breakout fails.
Target the next major technical level for profit-taking rather than holding for the entire day’s move. CPI-driven breakouts often reach their destination within 1-2 hours, then consolidate or reverse. Taking profits at logical resistance or support levels locks in gains from the high-probability initial momentum phase.
Fade the Overreaction
Sometimes CPI releases create exaggerated initial moves that reverse quickly when traders realize the data isn’t as significant as the immediate reaction suggested. Look for signs of exhaustion like long wicks, decreasing volume, or RSI divergence within the first 15-30 minutes. These signals indicate the move has overextended and is vulnerable to mean reversion.
Enter fade positions only after confirmation of reversal momentum. Wait for a clear rejection candle closing back inside the range or breaking the initial reaction low/high. Premature fading often results in getting run over by continued momentum, so patience and confirmation are essential for this strategy’s success.
Position sizing for fade trades should be smaller than breakout trades because you’re trading against the initial momentum. Use a 1:2 or 1:3 risk-reward ratio minimum since fade trades have lower probability than following established momentum. Moreover, set tight stops just beyond the extreme of the overreaction to prevent large losses if the move continues.
Follow-Through Session Trading
After the initial 1-2 hours, markets often establish clearer trends that persist through the session. The CPI reaction clarifies Fed policy expectations, creating sustained directional moves in bonds, currencies, and equities. Trading these follow-through trends offers lower-stress opportunities compared to the chaotic initial release period.
Identify the established trend using moving averages and higher timeframe structure. When the 9 EMA crosses above the 20 EMA on 15-minute charts after CPI data, it signals bullish momentum that often continues for several hours. Conversely, bearish crosses indicate sustained selling pressure worth following with short positions.
Enter on pullbacks to the 20 or 50 EMA within established trends rather than chasing price after it’s already moved. These retracements provide better risk-reward entry points while maintaining alignment with the dominant CPI-driven direction. Additionally, volume should support the pullback’s legitimacy—decreasing volume during retracements confirms healthy profit-taking rather than trend reversal.
Position Sizing and Risk Management
Never risk more than 1-2% of capital on any single CPI report trading setup. The heightened volatility during these releases can quickly turn winning positions into disasters without proper risk management. Use position sizing calculations based on your stop distance and account size to maintain consistent risk across all trades.
Set time limits for CPI-driven trades—most moves complete within 4-6 hours of the release. Holding positions overnight after CPI releases rarely provides additional edge and exposes you to gap risk from other news events. Taking profits during the session when targets hit preserves gains and maintains capital for the next opportunity.
Use volatility-adjusted stops rather than arbitrary fixed-point levels. Calculate stops based on ATR (Average True Range) to account for the expanded price movement during CPI sessions. A stop placement that works during normal trading conditions will likely get hit by noise during CPI volatility, so wider stops adjusted for current market conditions improve survival rates.
Sector-Specific CPI Strategies
Technology Stocks
Tech stocks typically benefit from rate cut expectations triggered by lower-than-expected CPI readings. Growth stocks are particularly sensitive to interest rate changes because their valuations depend on discounting future earnings. Therefore, when CPI comes in cool, tech names often outperform the broader market significantly.
Conversely, hot inflation data pressures high-multiple tech stocks more severely than value sectors. The Fed’s hawkish response to persistent inflation raises discount rates, making future tech earnings less valuable today. Trading the tech sector specifically during CPI releases provides amplified exposure to the interest rate sensitivity inherent in these names.
Treasury Bonds
Bond traders react immediately to CPI data since inflation directly erodes fixed-income returns. Lower inflation increases bond prices (lowers yields) as rate cut expectations rise. Meanwhile, higher inflation pressures bonds lower as investors demand higher yields to compensate for purchasing power loss.
The 10-year Treasury yield often moves 10-20 basis points within minutes of significant CPI surprises. This relationship creates opportunities in bond futures, Treasury ETFs, or yield-sensitive sectors like utilities and REITs. Additionally, the TLT ETF provides accessible exposure to Treasury price movements for traders without futures accounts.
Currency Markets
The U.S. dollar typically strengthens when CPI beats expectations because hot inflation keeps the Fed hawkish, maintaining high U.S. interest rates relative to other countries. This interest rate differential attracts capital flows into dollar-denominated assets, boosting the currency. Conversely, softer inflation weakens the dollar as rate cut expectations reduce U.S. yield advantages.
EUR/USD, GBP/USD, and USD/JPY pairs show strong reactions to CPI data, often moving 50-100 pips within the first hour. Currency traders use these releases to position for multi-day trends rather than just scalping the immediate reaction. The sustained policy implications of inflation data create longer-lasting directional moves in forex compared to equity markets.
Common CPI Trading Mistakes
Many traders enter positions before the release hoping to profit from the move, but this gambling approach exposes them to random outcomes regardless of the data. Similarly, chasing the initial spike without waiting for confirmation leads to poor fills and immediate drawdown. Instead, let the data print, observe the initial reaction, then enter systematically based on your strategy rules.
Another critical error involves holding positions through CPI releases without hedging or adjusting stops. The volatility can gap price through normal stop levels, creating losses far exceeding planned risk. If you’re already in positions before CPI, either close them, hedge with options, or accept that your risk may exceed normal parameters during the release.
Traders also make the mistake of trading every CPI release identically without adapting to changing market conditions. When markets already expect aggressive Fed action, CPI data confirming those expectations often produces muted reactions. Learn to recognize when CPI releases are “priced in” versus when they’ll create genuine surprises that drive significant moves.
Advanced CPI Trading Techniques
The CPI Divergence Play
Trade divergences between different CPI components for sustained positioning beyond the immediate release. When services inflation accelerates while goods inflation cools, it signals shifting economic dynamics. The Fed focuses heavily on services inflation because it’s wage-driven and persistent, so this divergence often predicts extended hawkish policy despite headline CPI potentially appearing benign.
Position for these multi-week trends by analyzing the detailed CPI components released with the headline numbers. Look for shelter costs, medical services, and transportation services showing acceleration even if overall CPI moderates. These underlying trends influence Fed rhetoric and policy decisions for months, creating tradeable themes beyond single-day volatility.
Options Strategies for CPI
The straddle strategy involves buying both a call and put at the same strike price before CPI releases, profiting from large moves in either direction. This approach works best when implied volatility is relatively low before the release, making the options premium affordable. However, if everyone expects big moves, options premiums expand, making straddles expensive and harder to profit from.
Iron condors and other premium-selling strategies work when you expect CPI data to align with expectations, producing muted reactions. Sell options at strikes beyond the expected move, collecting premium when price stays within the range. This strategy requires accepting significant risk if CPI data creates surprise moves that exceed your strike prices.
Preparing for the Next CPI Release
CPI data releases on the second Tuesday of each month at 8:30 AM ET. Mark your calendar and prepare your trading plan in advance rather than scrambling the morning of the release. Review previous CPI reactions for your specific trading instruments to understand historical patterns and probabilities.
Build a checklist covering your pre-release analysis, position entry criteria, stop placement, and profit targets. Having this systematic approach documented prevents emotional decision-making during the heat of volatility. Additionally, paper trade your CPI strategies first to build confidence and refine your approach before risking real capital.
Stay flexible and adapt your strategy based on evolving market conditions. What worked during 2023’s aggressive rate hiking cycle may not work in 2025’s potential easing environment. Continuously study how markets react to inflation data and adjust your approach accordingly to maintain an edge.
CPI report trading offers some of the most explosive and tradeable opportunities each month for prepared traders. Master these strategies to transform inflation releases from chaotic events into systematic profit opportunities.

Leave a Reply