Table of Contents (Show/Hide)
Most traders lose money on SPY for a reason that never shows up on a chart: they run a trend-following strategy inside a choppy market, or a mean-reversion strategy inside a trend. Same setup, opposite outcomes — decided entirely by the SPY market regime you are trading in. A breakout that pays three R on Tuesday is bait on Friday, and nothing about your entry changed. This page gives you a real-time quantitative engine that reads market regime bias on demand, scans Grade A leaders for high-conviction setups, and breaks down the exact institutional playbook for each of the three states — so you always know whose rulebook today belongs to.
What Is a SPY Market Regime (And Why It Matters More Than Your Entry)
A market regime is the overarching behavior of the market — not where price will close next month, but how liquidity and tape velocity are behaving right now. Every trading session fits one of three quantitative states: bullish (liquidity expansion, dips bought, upside follow-through), bearish (systemic distribution, rallies faded, breakdown continuation), or choppy (equilibrium, range compression, liquidity churn).
These states are not opinions or financial television commentary. In our engine, they are measured across five quantitative macro pillars: overnight S&P 500 (ES=F) and Nasdaq (NQ=F) futures momentum, the velocity of the Volatility Index (^VIX), the CNN Fear & Greed sentiment index, and natural language sentiment (NLP) scraped from Federal Reserve and macroeconomic headlines.
Why care more about regime than your specific entry trigger? Because your entry only dictates timing; the regime decides whether the strategy type itself possesses positive mathematical expectancy. Test a trend-following breakout strategy in a trending bull market versus a sideways consolidation — the win rates diverge violently. Forcing momentum trades into chop or catching knives in a high-VIX liquidation is where retail accounts blow up and trading psychology collapses. This is exactly the pattern behind most trading psychology meltdowns: the tilt usually starts after repeated losses inside one hostile regime, which is why that page’s tilt calculator pairs naturally with the regime check below.
Check the SPY Market Regime Before Your Next Trade
The scanner below synthesizes live data across our five macro pillars to assign a composite Market Direction Score from 0 to 100:
- Score 60.0 to 100 — Bullish Regime: Liquidity expansion. Thomas Q. Edgeworth takes the helm, suppressing short setups to prioritize high-conviction breakout longs.
- Score 0 to 40.0 — Bearish Regime: Liquidity contraction. Smith the Butler takes control, suppressing long setups to prioritize high-conviction breakdown shorts.
- Score 40.1 to 59.9 — Balanced / Choppy Regime: Stalemate between the two characters. No directional edge exists, and capital preservation is advised.
Beyond macro classification, the engine scans a curated 48-ticker large-cap watchlist. It calculates pace-normalized Relative Volume (RVOL) to prevent morning volume distortion, measures 20-day and 50-day moving average alignment, scores 48-hour headline sentiment, and cross-checks exchange earnings calendars to flag binary gap risk ([E]) before execution. Press Run Conviction Scan below to inspect the tape.
Live Market Regime & Conviction Scanner
Where Thomas Q. Edgeworth’s relentless bull expansion meets Smith the Butler’s apocalyptic tail-risk discipline. Evaluates live ES/NQ futures, VIX velocity, Fear & Greed, and scans Grade A setups with pace-normalized RVOL and headline sentiment to decide who controls today’s tape.

How to Trade Each SPY Market Regime
The scanner provides the reading; the High Conviviction setups below dictate execution. Each market regime rewards one trading discipline while penalizing the other.
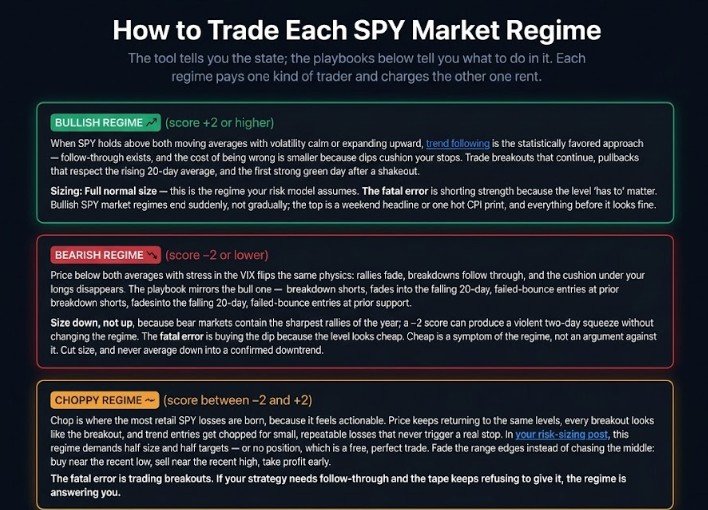
Bullish Regime (score +2 or higher)
Bullish Regime (Score 60.0 or Higher)
When the score crosses 60.0, broad futures momentum is positive, VIX is subdued or contracting, and macro sentiment is constructive. This is the environment championed by Thomas Q. Edgeworth: trend-following strategies possess mathematical follow-through, pullbacks into rising 20- and 50-day moving averages are defended by institutional buyers, and upside breakouts carry clean risk-reward.
Playbook: Focus on high-conviction long breakouts, buy pullbacks to rising moving averages, and execute on confirmed green reversal candles on intraday timeframes. Size with full standard risk — this is the regime your growth model assumes. The fatal trap is shorting resistance levels because the market feels “overextended.” Bullish regimes routinely stay irrational longer than short-sellers stay solvent.
Bearish Regime (score −2 or lower)
When the score drops to 40.0 or below, market physics invert. VIX velocity is expanding, futures indicate institutional liquidation, and sentiment registers severe risk aversion. In this regime, Smith the Butler’s tail-risk warnings govern the tape: upside bounces are exit pumps designed to trap dip-buyers, support levels fail to hold, and downside breakdowns follow through.
Playbook: Focus strictly on high-conviction shorts, fade weak relief bounces into declining moving averages, and execute breakdown continuation trades below key technical pivots. Manage sizing strictly — bear markets contain the sharpest, most violent short-squeeze rallies of the year. The fatal error is buying dips because a stock looks “cheap.” Cheap in a bear regime is a symptom of distribution, not a discount.
These regime shifts are not new inventions — Wikipedia’s Market trend entry documents the same primary-versus-secondary structure traders have graded since Dow, including why bear markets contain violent counter-rallies.
Choppy Regime (score between −2 and +2)
When the score sits between 40.1 and 59.9, neither bulls nor bears control the tape. This is consolidation purgatory: moving averages flatten, breakouts get faded, and volatility compresses into equilibrium. Both Edgeworth and Smith find themselves in a standoff.
Playbook: Cash is an active, profitable position. If you choose to trade, abandon trend-following completely and pivot to range-bound mean-reversion: fade the outer boundaries of the 10-day range with halved position sizes, tighter profit targets, and rapid stop execution. The fatal mistake in chop is chasing breakouts — momentum will trap you and chew up your account with repeated stop-outs. When the scanner flags chop, obey the advisory banner and keep your hands off the order book.
What you’re actually doing when you fade the edges is trading mean reversion — the documented tendency of price to converge back toward its average inside a range, with no directional edge to lean on. The fatal error is trading breakouts. If your strategy needs follow-through and the tape keeps refusing to give it, the regime is answering you. Always manage your position size in choppy market by using our Cross Broker Kill Switch tool. When this page’s checker scores the tape choppy, the tool says so without hedging: the no-trade card replaces the momentum board. Take the hint — it’s the one signal that costs nothing to obey.
Why Most Regime Indicators Fail Retail Traders
Most market regime indicators available online fall into two traps: proprietary black-box dials that offer zero transparency, or single lagging indicators masquerading as complete systems (such as a solitary 200-day moving average or an isolated ADX line). Both fail when volatility shifts because traders have no visibility into what actually changed under the hood.
The architecture powering this page is completely open, auditable, and multi-factor:
- It combines overnight index futures velocity (
ES=F,NQ=F) with options market pricing (^VIX). - It factors in institutional crowd positioning (CNN Fear & Greed) and real-time narrative sentiment (Google News NLP).
- It pairs the macro verdict with a live Grade A conviction matrix that adjusts volume for time-of-day pace.
There are no hidden subscriptions or mysterious proprietary formulas. A regime filter exists to keep you on the correct side of institutional order flow every single morning.
This Week’s SPY Market Regime
The tool above gives a live reading on demand. Every Monday, this section records the official weekly call and how it graded against the prior week — the running scoreboard is public, misses included, because a regime tool that’s never accountable is a horoscope.
This week’s regime: (auto-updated from the live checker — no manual edits) Last week’s call → what happened: (scoreboard row added every Monday)
Three Rules For Using This Regime Filter
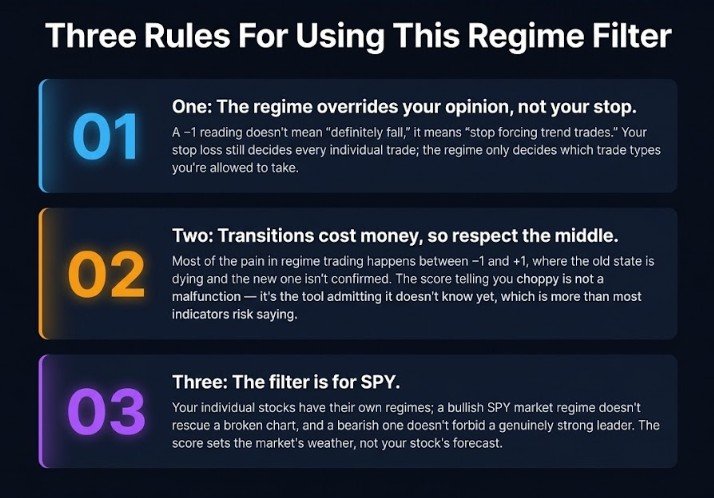
One: The regime dictates your playbook, not your stop loss. A Bearish score under 40.0 does not guarantee the market drops in a straight line; it signals that long setups have negative mathematical expectancy. Your stop loss protects individual trade risk, while the regime filter protects your overall account.
Two: Respect the middle. When the score hovers between 40.1 and 59.9, the engine is not malfunctioning — it is accurately reporting that institutional capital is in equilibrium. Sitting in cash during chop preserves capital for high-conviction trends.
Three: Broad market weather guides individual stocks. High-beta equities rarely sustain breakouts when index futures and VIX reflect systemic selling. Align your individual stock setups with the prevailing market wind before funding risk.
SPY Regime (FAQs)
Frequently Asked Questions (show/hide)
What is the best SPY market regime indicator? ▼
The best one is a simple one you can verify: price versus the 20- and 50-day moving averages for direction, recent range versus average range for expansion, and the VIX for stress. That trio is the entire formula on this page — free, checkable, and it changes the same decisions a $200/month dashboard would.
How often should I check the SPY market regime? ▼
Once per session, before your first trade, and again near the close if you hold overnight. Regimes change in days, not minutes — checking hourly just manufactures anxiety. The Monday update plus the tool on demand covers every legitimate use.
What happens when the tool is wrong? ▼
It will be wrong sometimes — the scoreboard tracks how often, publicly. A regime filter improves win rates by removing your worst-fit trades over a quarter, not by being right every day. When it’s wrong in a fast reversal, the score lags by one to two sessions; that’s the known cost of refusing to pretend certainty, and the stop loss exists precisely to cover the gap. The edge was never predicting the regime. It’s matching your strategy to the one you’re in — every single day, without exception. The tool is free, the formula is open, and the scoreboard keeps everyone honest, including us. Start with Monday’s plan post, check the tool before you fund any trade this week, and grade the results yourself.