
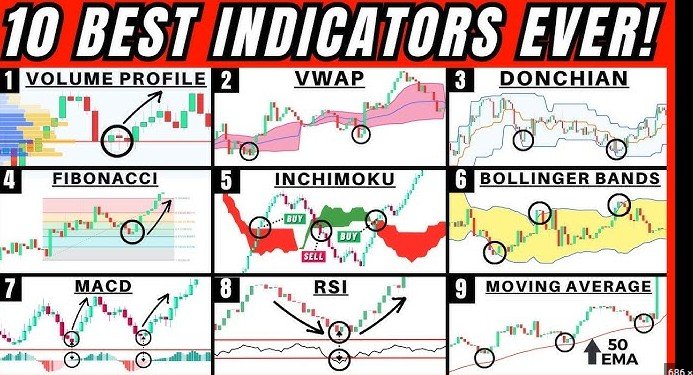
Technical indicators help traders analyze price movements, identify trends, and time entries and exits with precision. Furthermore, mastering a few essential indicators beats superficial knowledge of dozens, as the best traders focus on quality over quantity.
Understanding What Indicators Actually Do
Technical indicators are mathematical calculations based on price, volume, or both that transform raw market data into visual representations revealing patterns and opportunities. Consequently, they fall into four main categories: trend-following, momentum, volatility, and volume-based indicators. Most importantly, indicators are derivatives of price—they follow rather than predict, which means understanding this limitation prevents unrealistic expectations about indicator reliability.
No single indicator is perfect, as each has strengths and weaknesses depending on market conditions. Trend-following indicators excel during trending markets but generate false signals during consolidation. Meanwhile, oscillators work great in ranges but get crushed in strong trends. Therefore, the key is combining indicators that complement each other to filter false signals and improve probability.
Relative Strength Index (RSI):
How RSI Works
The Relative Strength Index (RSI) measures momentum by comparing the magnitude of recent gains to recent losses on a scale of 0 to 100. Readings above 70 indicate overbought conditions where selling pressure may increase. Conversely, readings below 30 suggest oversold conditions where buying opportunities often emerge.
RSI Trading Strategy
The standard RSI period is 14, but adjusting to 10 provides faster signals for day trading while 21 works better for swing trading. Enter long positions when RSI rises above 30 from oversold territory, confirming buyers are stepping in. Similarly, consider short positions when RSI falls below 70 from overbought levels.
RSI Divergence Power
RSI divergence occurs when price makes new highs but RSI fails to confirm, signaling weakening momentum. This divergence often precedes significant reversals and provides early warning signals before price changes direction. Therefore, always scan for divergences at potential turning points near major support and resistance levels.
MACD Indicator
MACD Components
The Moving Average Convergence Divergence (MACD) consists of three elements: the MACD line, signal line, and histogram. The MACD line calculates the difference between two exponential moving averages, typically 12 and 26 periods. Additionally, the signal line is a 9-period EMA of the MACD line that generates crossover signals.
MACD Trading Signals
A bullish signal appears when the MACD line crosses above the signal line, indicating upward momentum is building. Meanwhile, bearish crossovers where the MACD line crosses below the signal line suggest downward pressure. The histogram shows the distance between these lines, with expanding histograms confirming trend strength.
Advanced MACD Settings
The 3-10-16 MACD configuration provides faster signals than the standard 12-26-9 setup for active day trading. This adjustment makes MACD more responsive to recent price action while still filtering out excessive noise. However, slower settings work better for swing trading where you want fewer but more reliable signals.
Combining RSI and MACD Strategy:
The Power of Confluence
The RSI and MACD strategy is considered one of the most effective trading approaches worldwide. This combination achieves approximately 73% win rates when applied correctly because RSI identifies entry zones while MACD confirms trend direction. Moreover, using both indicators together reduces false signals that plague traders using single indicators.
Entry Rules
First, wait for RSI to enter oversold territory below 30 for long setups or overbought above 70 for shorts. Next, monitor MACD for confirmation—the MACD line must cross the signal line in the same direction. Finally, enter when the histogram begins expanding, showing momentum is accelerating. This triple confirmation dramatically improves entry timing and reduces whipsaws.
Moving Averages: The Foundation:
Simple vs Exponential Moving Averages
Moving averages smooth price data to reveal underlying trends more clearly than raw candlesticks. The 50-day and 200-day moving averages are the most widely followed by institutions, making them self-fulfilling support and resistance levels. Furthermore, when price trades above these averages, the trend is up; below them, the trend is down.
Moving Average Crossovers
The golden cross occurs when the 50-day MA crosses above the 200-day MA, signaling long-term bullish momentum. Conversely, the death cross happens when the 50-day crosses below the 200-day, indicating bearish conditions ahead. These major crossovers often mark significant turning points that last for months.
Bollinger Bands for Volatility
Bollinger Band Basics
Bollinger Bands consist of a middle line (typically a 20-period SMA) with upper and lower bands set at 2 standard deviations. These bands expand during volatile periods and contract during quiet consolidation. Consequently, Bollinger Bands help traders identify both volatility conditions and potential reversal zones.
Bollinger Band Strategy
When price touches the lower band in an uptrend, it often presents buying opportunities as the price typically reverts to the middle band. Similarly, touches of the upper band in downtrends provide shorting opportunities. However, in strong trends, price can ride the outer bands for extended periods, so always confirm with momentum indicators.
Advanced Band Settings:
Using multiple Bollinger Bands with 1, 2, and 3 standard deviations on a 200-period SMA provides clearer trend context. When price trades above the middle line, the uptrend is confirmed; below indicates a downtrend. This multi-band approach helps traders stay on the right side of the trend.
Average True Range (ATR)
ATR for Position Sizing
The Average True Range measures market volatility by calculating the average price movement over a specified period, typically 14 days. ATR doesn’t indicate direction but rather how much the market is moving. Therefore, ATR becomes invaluable for setting stop losses and position sizing based on current volatility.
The 2x 4x ATR Method
Place stop losses at 2x ATR from your entry to avoid getting stopped out by normal market noise. Meanwhile, set profit targets at 4x ATR to maintain a 2:1 reward-to-risk ratio. This dynamic approach adjusts to market conditions automatically, tightening stops in calm markets and widening them during volatile periods.
Volume Indicators
On-Balance Volume (OBV)
OBV tracks cumulative volume analysis flow by adding volume on up days and subtracting it on down days. Rising OBV confirms uptrends while falling OBV validates downtrends. More importantly, OBV divergences where volume fails to confirm new price highs or lows often precede major reversals.
Common Technical Indicator Mistakes:
Many beginners clutter charts with too many conflicting indicators, creating analysis paralysis rather than clarity. Similarly, using indicators in isolation without considering broader market context leads to poor timing. Instead, select 2-3 complementary indicators that work together to confirm signals.
Another critical error involves using default settings without understanding whether they suit your trading timeframe. Day traders need faster, more responsive settings while swing traders require slower, more stable configurations. Therefore, always adjust indicator parameters to match your specific trading style and timeframe.
Practical Tips for Indicator Success
Start by mastering one indicator at a time rather than jumping between dozens. Additionally, backtest your indicator combinations on historical data to understand their strengths and limitations before risking real capital. Finally, remember that technical indicators work best when combined with price action analysis and proper risk management principles.
The most successful traders use technical indicators as confirmation tools within a complete trading system, not as standalone signal generators. This balanced approach transforms indicators from confusing noise into reliable decision-making aids.

Leave a Reply