Tesla weekly trading plan for Oct 5–9: key levels, bull vs bear triggers, and which Oct 9 weekly calls and puts fit each setup. Quotes dated Oct 5, 2026.
TSLA Weekly Trading Plan: Bull vs. Bear Levels, Triggers, and Options
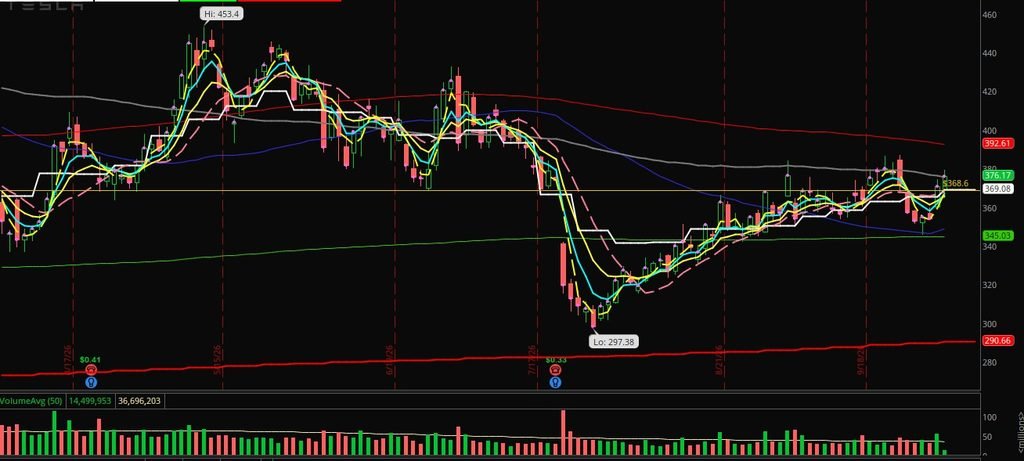
Table of Contents
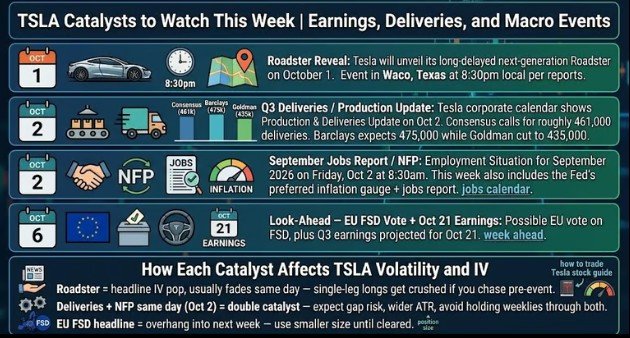
TSLA Catalysts to Watch This Week
Look Ahead:
– Oct 6 Look-Ahead – EU FSD Vote + Oct 21 Earnings: Possible EU vote on FSD, plus Q3 earnings projected for Oct 21.
How Each Catalyst Affects TSLA Volatility and IV
- Roadster = headline IV pop, usually fades same day — single-leg longs get crushed if you chase pre-event.
- Deliveries + NFP same day (Oct 2) = double catalyst — expect gap risk, wider ATR, avoid holding weeklies through both.
- EU FSD headline = overhang into next week — use smaller size until cleared.
The One Number That Decides the Week
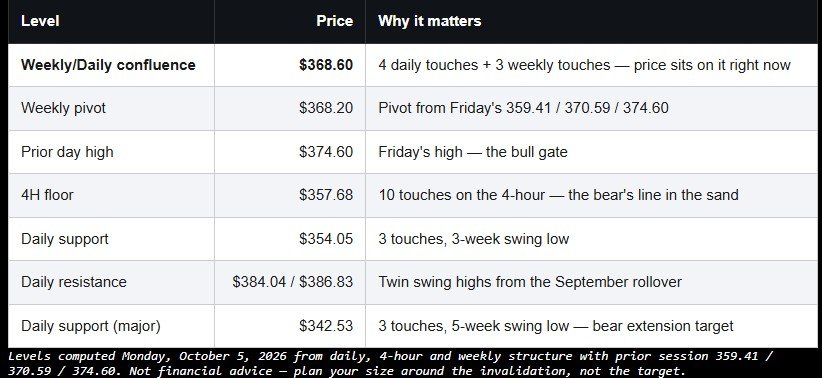
368.60. TSLA is parked on it this morning. This level has been tested 7 times across daily and weekly timeframes in the last 4 months. A week that opens on a level this contested resolves one of two ways, and both paths are low-risk to define.
The Bull Case: Pre-Earnings Accumulation Into Earnings Week
Bull Trigger
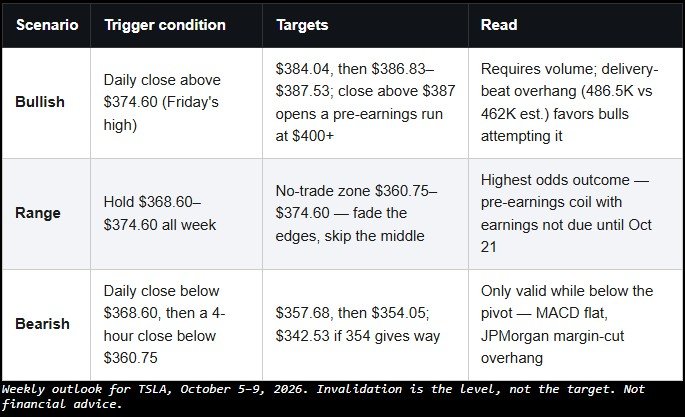
Price holds above 368.60 through the first day, then closes a daily bar above 374.60 (Friday’s high and prior-day high). That close clears the last structure overhead and confirms delivery-beat buyers are still in control.
Bull Entry and Targets
- Entry: Break-and-retest of 374.60, or a pullback hold of 368.60–369 with a same-day reclaim
- Target 1: 384.04 (+4.0% from here) — the 4-touch daily swing high
- Target 2: 386.83–387.53 — the double ceiling from five days ago, which also flips from a 4H support into resistance
- Extension: A close above 387 opens a pre-earnings run at 400+ into the Oct 21 print
Bull Invalidation
Any daily close back below 368.60 cancels the long thesis mid-week. Below 360.75 the bull case is fully dead.
Bull Fuel This Week
- Delivery beat (486.5K vs 462K est.) still has follow-through room — the stock only rallied ~6% from the 353 lows
- September registrations trending positive in early European compiler data (Denmark +2.9% YoY)
- A quiet news week lets technicals drive; buyers positioning ahead of Oct 21 earnings
TSLA Bulls vs Bears — Full Trading Plan: Levels, Triggers and Options
Tesla enters the week at $369.30 (pre-market Monday), sitting directly on the most important level on the board. Q3 deliveries (486,532, down 2.1% year-over-year but ~25,000 above the ~462K consensus) were digested last week, and with earnings not due until Wednesday, October 21, this is a pure technical consolidation week — a coil before the catalyst.
The Level Map (Multi-Timeframe Confluence)
The One Number That Decides the Week
368.60. TSLA is parked on it this morning. This level has been tested 7 times across daily and weekly timeframes in the last 4 months. A week that opens on a level this contested resolves one of two ways, and both paths are low-risk to define.
The Bull Case: Pre-Earnings Accumulation Into Earnings Week
Bull Trigger
Price holds above 368.60 through the first day, then closes a daily bar above 374.60 (Friday’s high and prior-day high). That close clears the last structure overhead and confirms delivery-beat buyers are still in control.
Bull Entry and Targets
- Entry: Break-and-retest of 374.60, or a pullback hold of 368.60–369 with a same-day reclaim
- Target 1: 384.04 (+4.0% from here) — the 4-touch daily swing high
- Target 2: 386.83–387.53 — the double ceiling from five days ago, which also flips from a 4H support into resistance
- Extension: A close above 387 opens a pre-earnings run at 400+ into the Oct 21 print
Bull Invalidation
Any daily close back below 368.60 cancels the long thesis mid-week. Below 360.75 the bull case is fully dead.
Bull Fuel This Week
- Delivery beat (486.5K vs 462K est.) still has follow-through room — the stock only rallied ~6% from the 353 lows
- September registrations trending positive in early European compiler data (Denmark +2.9% YoY)
- A quiet news week lets technicals drive; buyers positioning ahead of Oct 21 earnings
TSLA Bulls vs Bears — Full Trading Plan: Levels, Triggers and Options
Tesla enters the week at $369.30 (pre-market Monday), sitting directly on the most important level on the board. Q3 deliveries (486,532, down 2.1% year-over-year but ~25,000 above the ~462K consensus) were digested last week, and with earnings not due until Wednesday, October 21, this is a pure technical consolidation week — a coil before the catalyst.
The Level Map (Multi-Timeframe Confluence)
The Bear Case: Rejection at the Coil, Breakdown Toward 357
Bear Trigger
Rejection at the 374.60–377 resistance shelf on the first or second attempt, followed by a daily close below 368.60. The faster tell: a 4-hour close below 360.75.
Bear Entry and Targets
- Entry: Failed breakout above 374 with a same-day reversal, or the close below 368.60
- Target 1: 357.68 — the 10-touch 4H floor (-3.2% from here)
- Target 2: 354.05 — daily swing-low cluster (-4.1%)
- Extension: 342.53 if 354 gives way — that’s the floor that held the September base
Bear Invalidation
A daily close above 374.60 ends the short thesis for the week. No bearish plan below the 368 line should be initiated above 372.
Bear Fuel This Week
- MACD flat at zero, momentum stalled — this is a consolidation, not a trend
- JPMorgan cut targets last week citing margin compression (1.4% operating margin headline)
- $30B in new credit facilities signed Sept 29 ($8B revolver, $20B delayed-draw term loan) — war chest, but it signals net-debt-funded expansion the bears will lean on
- Earnings two weeks out: no reason for institutions to chase before the print
How to Trade the Chop
The No-Trade Zone
Between 360.75 and 374.60 this is a 14-dollar box with a coil inside it. Mid-range entries have no defined risk. If you don’t have a trigger condition on the levels above, the correct position this week is flat. Their are many ways to avoid trading the chop.
Weekly Scorecard
TSLA Weekly Options: How to Play the Oct 16th Expiry
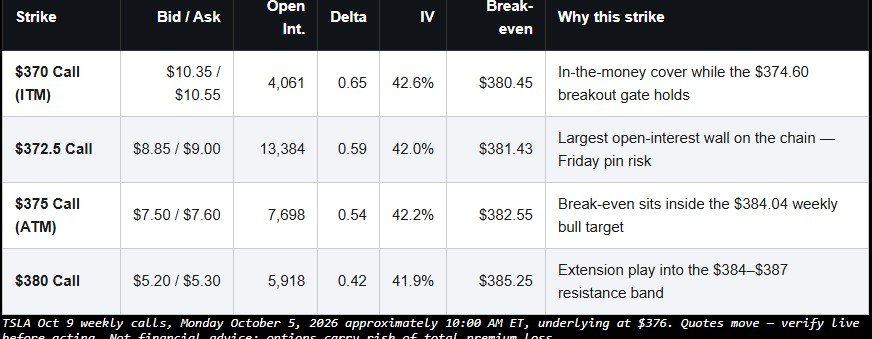
All prices from the live chain Monday, October 5 at ~10:00 AM ET, with TSLA at $376. The Oct 9 weekly is the only expiry with a full week to run before the October 21 earnings print.
The Setup: Breakout Morning, Priced In Already
TSLA gapped into the breakout zone, trading above the $374.60 gate at around $376. That matters for option buyers: the calls haven’t gotten cheaper — they’ve gotten more expensive, up 38–45% this morning. IV sits near 42% across the front of the chain, and the ATM theta on the weekly is roughly -$0.80 per day per share, meaning a flat contract loses about 10% of its value every day it sits still. Weekly options here are a precision tool, not a lottery ticket. Bull Case: The Oct 9 Calls That Match the Levels
The $372.5 call is the strike to watch — 13,384 open interest, by far the largest on the chain. Market makers short it will hedge above it and fade below it, making it a pin candidate into Friday.
- The disciplined bull buy is the $375 call at ~$7.55. Break-even is $382.55, only +1.7% away — inside Thursday’s projected bull target of $384.04. The trade only pays if the daily close clears $374.60 and holds.
- The $380 call fits the upper target zone. Break-even $385.25 lines up with the $384–$387 resistance band, meaning this contract profits only on the extension move — the “close above $387, run at $400” branch.
Bear Case: The Oct 9 Puts, Kept Honest
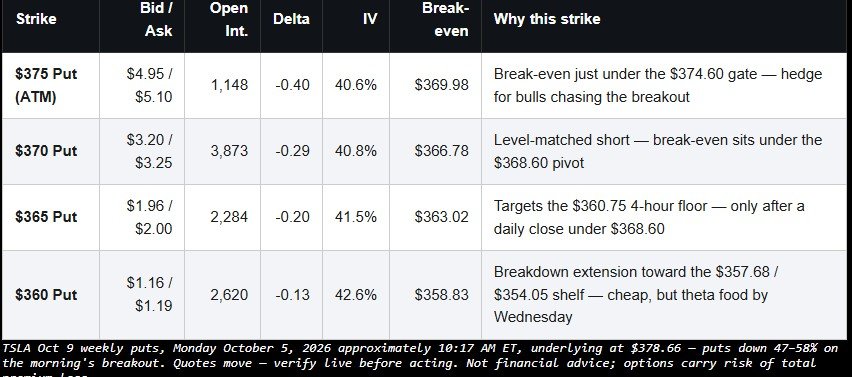
- The $370 put is the level-matched short. Break-even $365.85 sits just under the $368.60 confluence pivot — the put pays exactly when the weekly plan says the bull case is dead.
- The $365 put prices the full breakdown. Its $362.40 break-even targets the $360.75 4-hour floor directly. Buy it only on a daily close below $368.60, never before.
- Skip the sub-$355 lottery tickets. The $350 put is $0.58 with 0.07 delta — a 4.7% down move just to break even, and theta eats it alive by Wednesday.
The Trap in This Week’s Chain
Three things every weekly-option buyer should know before Monday noon: first, today’s move already repriced calls 38–45% — you’re paying breakout prices for a breakout that may be one red candle from fading back into the $368–$375 box. Second, with earnings on October 21, this weekly expires before the catalyst, so there’s no event to rescue a wrong trade — pure theta decay from Thursday onward. Third, the 13,384-lot open interest wall at $372.5 means a Friday close near that strike pays both sides of the chain poorly. Define the level first, then buy the strike whose break-even sits at your target. Never the other way around.
TSLA Macro FAQ – Jobs, Fed, Yields and Market Risk
How does Friday’s September jobs report affect TSLA price action?
Friday Oct 2 at 8:30am ET is the September Employment Situation report, landing the same day as Tesla Q3 deliveries. Strong jobs data typically lifts Treasury yields and pressures high-multiple growth names like TSLA, even on a good deliveries print. Weak jobs data can lift TSLA with the market on Fed-cut hopes, but also raises demand fears. Day traders should avoid new weekly positions into 8:30am and wait for the first 15-minute range to rebuild after the number.
Why do rising Treasury yields hit TSLA harder than the broader market?
TSLA trades like long-duration growth. When yields rise, future earnings are discounted more heavily and margin-debt cost rises, which compresses TSLA’s multiple faster than the S&P 500. Last week the S&P held near 7,820 all-time highs despite rising bond yields, but single-name growth lagged. For your plan: on high-yield days, favor VWAP-fade and failed-breakdown shorts under prior-day low, and take profit faster on breakout longs.
How much does SPY and QQQ direction matter when day trading TSLA options?
A lot. TSLA is a top weight in both QQQ and S&P 500-related flows, so a weak QQQ open will drag TSLA through VWAP even with a bullish stock-specific setup. Before every TSLA trade, check QQQ direction, VWAP position, and whether SPY is breaking its own opening range. If index and TSLA signals conflict, cut size in half or skip. Only take full size when TSLA, QQQ, and SPY align above VWAP or below it together. Spy is a key instrument when it comes to deciding which stock to trade on any given week.
Do inflation data, the dollar, and oil matter for a TSLA weekly plan?
Yes, as second-order volatility drivers. Hot PCE or CPI reprices Fed expectations, strengthens the dollar, and usually weakens TSLA with growth. Oil spikes matter differently — they can help Tesla’s EV narrative but hurt overall consumer sentiment and market multiples. You don’t need to trade them, just use them as a risk filter: if DXY and yields are spiking, trade smaller, widen invalidation, and avoid holding single-leg weeklies overnight.
How should I size TSLA differently for macro risk vs stock-specific catalysts?
Risk is a big part of trading. You will have better entries on your trades if you understand how risk reward works. Use half size and no adds until after the specific event print. Stock-specific risk Roadster and deliveries affects TSLA IV directly and causes IV crush after — avoid new long premium into the headline. If both hit the same day stand aside pre-event and trade the post-event trend confirmation only.