Table of Contents (Show/Hide)
Table of Contents
Retail traders love the idea of a short squeeze, but most end up becoming exit liquidity for institutional algorithms. They chase generic social media hype without understanding the underlying mechanics of supply, demand, and trapped short sellers.
True short squeeze scanner settings requires two things: Fuel (high short interest locked in a small float) and a Spark (abnormal volume driven by a catalyst).
If you want to stop guessing and start tracking these setups quantitatively, you need to filter out the noise. Below is the exact 6-point screener architecture to isolate high-probability squeeze candidates before the main retail crowd catches on, along with our interactive tracking tool.
The 6-Point Short Squeeze Scanner Settings “Squeeze Fuel” Criteria
To filter out the thousands of irrelevant tickers, we use a strict set of parameters. These can be plugged directly into Finviz Elite, Trade Ideas, or your Thinkorswim Stock Hacker.
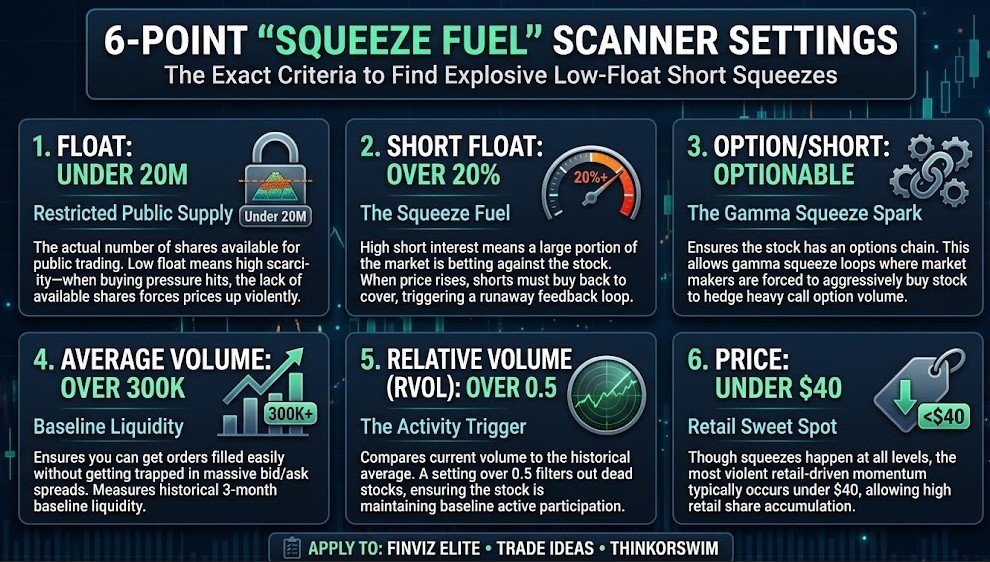
1. Float: Under 20M Shares The float represents the actual number of shares available for public trading. A low float (under 20 million) means supply is heavily restricted. When sudden buying pressure hits, the lack of available shares forces the price up violently.
2. Short Float: Over 20% This is the fuel. If over 20% of the available float is sold short, it means a significant portion of the market is betting against the company. If the stock begins to surge, these short sellers are forced to buy back their shares at market price to cover their losses, creating a runaway feedback loop of buying pressure.
3. Option/Short: Optionable This is a critical, often-overlooked filter. By ensuring the stock has an active options chain, you open the door for a gamma squeeze. When retail traders flood into out-of-the-money call options, market makers must buy the underlying stock to hedge their exposure, throwing gasoline on the initial short squeeze fire.
4. Average Volume: Over 300K You cannot trade a squeeze if you cannot get your orders filled. Setting a baseline 3-month average volume of at least 300,000 shares ensures the stock has enough baseline liquidity that you won’t get trapped in massive bid/ask spreads.
5. Relative Volume (RVOL): Over 0.5 RVOL compares today’s volume to the historical average. While we want massive RVOL on the actual breakout day (often 3.0 or higher), setting the baseline filter to >0.5 ensures the stock isn’t completely dead and is maintaining at least baseline institutional participation leading up to the move.
6. Price: Under $40 Squeezes happen at all price levels, but the most violent retail-driven momentum typically occurs under the $40 threshold. This price point allows retail traders to buy meaningful share sizes, increasing the chaotic volume needed to trap the shorts.
Interactive Short Squeeze Radar
Use the terminal below to view today’s prime squeeze candidates that meet the strict 20% Short / Sub-20M Float criteria.
Short Squeeze Radar
Identifying heavily shorted, low-float equities primed for volatility.
Analyzing short interest and float data…
How to Vet the Scanner Results (The 4-Step Execution Checklist)
A scanner simply gives you a watchlist; it does not give you a trade. Before you execute a position on a flagged ticker, you must run it through this manual verification loop.
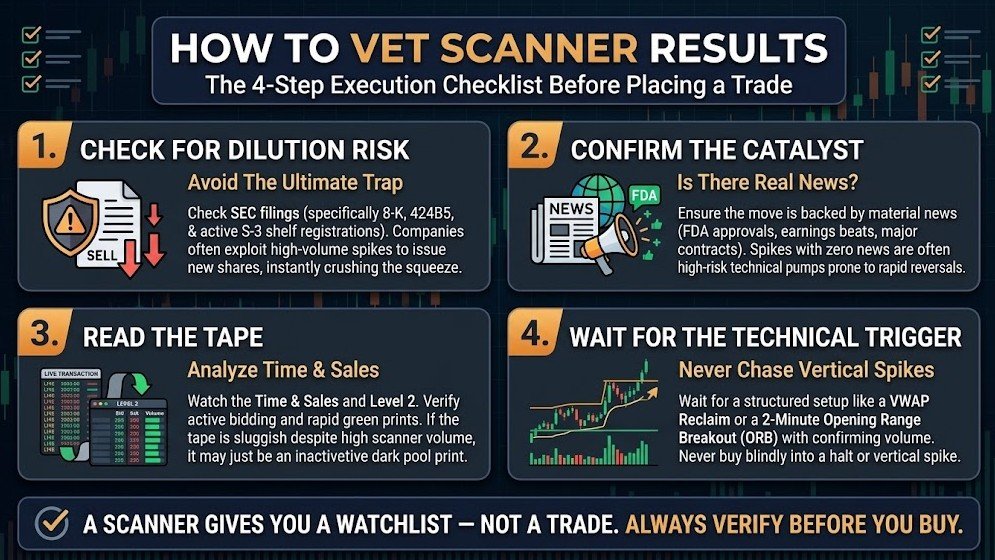
1. Check for Dilution Risk (The Ultimate Trap)
Free screeners notoriously report inaccurate float sizes because they do not update share counts in real-time. Before trading a low-float squeeze, check the SEC filings (specifically 8-K and 424B5 forms). If the company has an active S-3 shelf registration, a sudden pre-market spike will often be met with heavy selling pressure from the company itself issuing new shares.
2. Confirm the Catalyst
Why is the stock moving? Check the news feeds. A true squeeze needs a material catalyst—an FDA approval, an earnings beat, or a major contract win. If a low-float stock is spiking with zero news, it is a purely technical pump and carries a significantly higher risk of an immediate, sharp reversal.
3. Read the Tape
Load the ticker into your charting platform and watch the Time & Sales and Level 2 data. Are the bids stacking up? Is the tape moving rapidly with continuous green prints? If the scanner shows high volume but the tape is sluggish, the volume may have come from a single dark pool block trade rather than sustained momentum.
4. Wait for the Technical Trigger
Never buy blindly into a halt or a vertical spike. Wait for a structured technical setup. The safest entries often occur on a VWAP Reclaim or a 2-Minute Opening Range Breakout (ORB) with confirming volume.
Risk Management: Protecting Your Capital
Trading short squeezes requires extreme discipline. Because these equities are highly volatile, they can gap down just as fast as they squeeze up. Read more about short squeezes here.
Always calculate your exact share size before entering. Utilize ATR Volatility Stops rather than arbitrary percentage stops to account for the erratic price action, and never risk more than 1% to 2% of your total account equity on a single squeeze play. If the setup fails to break out and falls back below VWAP, cut the loss immediately. The tape does not care about your thesis.
For more on locking down your risk parameters, review our full guide on Risk with our Risk Calculator.